Are NFL Games Rigged? Super Bowl Ratings, Market Size, Taylor Swift and Penalties: Here's What the Last 10 Years of Data Said
We checked 10 Super Bowls, 122 playoff games and about 31,000 penalties. The numbers show no sign of games being steered to big markets, a Taylor Swift bump we can't prove, and a penalty edge worth about half a point at most.
KEY FINDINGS
THE LAST 10 SUPER BOWLS
| LI | 2017 |  Patriots |  Falcons | 34-28 (OT) | 111.3 | 45.3 | Boston 10 / Atlanta 7 |
| LII | 2018 |  Eagles | Patriots | 41-33 | 103.4 | 43.1 | Philadelphia 5 / Boston 10 |
| LIII | 2019 | Patriots |  Rams | 13-3 | 98.2 | 41.1 | Boston 10 / Los Angeles 2 |
| LIV | 2020 |  Chiefs |  49ers | 31-20 | 99.9 | 41.6 | Kansas City 32 / San Francisco 9 |
| LV | 2021 |  Buccaneers | Chiefs | 31-9 | 91.6 | 38.2 | Tampa 11 / Kansas City 32 |
| LVI | 2022 | Rams |  Bengals | 23-20 | 99.2 | 36.9 | Los Angeles 2 / Cincinnati 37 |
| LVII | 2023 | Chiefs | Eagles | 38-35 | 115.1 | 40.0 | Kansas City 32 / Philadelphia 5 |
| LVIII | 2024 | Chiefs | 49ers | 25-22 (OT) | 123.7 | 43.5 | Kansas City 32 / San Francisco 9 |
| LIX | 2025 | Eagles | Chiefs | 40-22 | 127.7 | 41.7 | Philadelphia 5 / Kansas City 32 |
| LX | 2026 |  Seahawks | Patriots | 29-13 | 125.6 | 39.7 | Seattle 13 / Boston 10 |
Click a column to sort. Click again to reverse it, and once more to go back to the original order.
Market rank: 2025-26 Nielsen TV market rank (1 = biggest, about 210 total). Rating = percent of all US TV homes watching.
PART 1: IS IT GOING UP EVERY YEAR BECAUSE THE NFL IS MORE POPULAR?
- Total viewers rose about 2.9 million a year since 2017, from 111.3 million to 125.6 million, with a low of 91.6 million in 2021. That trend is unlikely to be chance (p = 0.03).
- The Nielsen rating, the share of TV homes watching, did not rise: 45.3 in 2017, 39.7 in 2026 (about -0.3 points a year, within noise).
- Why they disagree: US TV homes grew about 7% (119.6 million in 2017-18 to 128 million in 2025-26), and Nielsen added streaming, out-of-home viewing (bars, airports) and in 2026 a new Big Data + Panel method.
- The 2025 regular season averaged 18.7 million viewers per game, up 10% and the second best on record. Reports tie part of that gain to the new measurement.
- Best years: LI (2017, Patriots-Falcons, overtime) at 45.3 and LVIII (2024, Chiefs-49ers, overtime) at 43.5. Worst: LVI (2022, Rams-Bengals, a 3-point game) at 36.9 and LV (2021, Buccaneers-Chiefs, a 22-point blowout) at 38.2. Score margin did not predict viewership (correlation -0.07).
WHICH TEAMS DREW THE MOST?
| Falcons | 1 | 111.3 | 45.3 | +14.8 | +2.7 |
| 49ers | 2 | 111.8 | 42.6 | +0.8 | +1.6 |
| Patriots | 4 | 109.6 | 42.3 | +4.4 | +0.7 |
| Eagles | 3 | 115.4 | 41.6 | +4.4 | +0.7 |
| Chiefs | 5 | 111.6 | 41.0 | -1.2 | +0.3 |
| Seahawks | 1 | 125.6 | 39.7 | +3.0 | +0.1 |
| Rams | 2 | 98.7 | 39.0 | -8.0 | -2.4 |
| Buccaneers | 1 | 91.6 | 38.2 | -16.5 | -3.1 |
| Bengals | 1 | 99.2 | 36.9 | -11.8 | -4.0 |
Click a column to sort. Click again to reverse it, and once more to go back to the original order.
A plus means more than the year's trend predicts. Teams with one game are too small to read much into.
PART 2: ARE THE GAMES STEERED TO BIG MARKETS?
- The 20 team slots averaged a TV market rank of 15.3 (1 is biggest, of about 210). The average NFL team is 19.4. 12 of the 20 slots went to top-10 markets, which hold 12 of 32 teams (37.5%).
- In 20,000 simulated random Super Bowls, a group at least this big-market came up 11% of the time. That is not unusual.
- Kansas City (rank 32) played 5 times. Cincinnati (37) played. No New York, Chicago, Dallas, Houston or Washington team made it.
- These were good teams: the 20 teams averaged a .773 regular-season win percentage (about 13 wins in 17 games).
- Market size did not predict ratings: correlation with viewers -0.12, with ratings -0.30 (neither significant).
- Playoff luck test: over all 122 playoff games from 2016 to 2025, the bigger-market team beat the point spread by 0.45 points on average (margin of error about 1.1). That is zero. In wild-card and divisional rounds it was -1.2 and -0.5.
- The one odd number: in the 20 conference championship games, the bigger-market team won 16 and beat the spread by 6.1 points. That happens by chance about 3% of the time in a single test, but I checked several slices and 70% of those teams were also at home. Most likely chance.
- Favorites won 63% of conference championships and Super Bowls, close to the 66% in the regular season.
PART 3: THE TAYLOR SWIFT FACTOR
| Chiefs in the game | 5 | 111.6 | 41.0 |
| Chiefs not in the game | 5 | 107.5 | 41.2 |
| Chiefs, before Swift (LIV 2020, LV 2021, LVII 2023) | 3 | 102.2 | 39.9 |
| Chiefs, after Swift (LVIII 2024, LIX 2025) | 2 | 125.7 | 42.6 |
Click a column to sort. Click again to reverse it, and once more to go back to the original order.
- Swift began attending Chiefs games in fall 2023. The Chiefs' five Super Bowls split into three before her (2020, 2021, 2023) and two after (2024, 2025).
- The Chiefs alone do not raise ratings: their games averaged about 4 million more viewers and 0.2 points less rating than others, both inside the margin of error.
- After Swift, Chiefs games jumped by 23.5 million viewers and 2.7 rating points versus the earlier three.
- But the whole league's count rose. Super Bowl LX in 2026 had no Chiefs and drew 125.6 million. Adjusting for the time trend, the Swift effect is about +17 million viewers and +4.6 rating points, with a huge range (-6 to +40 million; -0.5 to +9.8 points). Two games cannot settle it.
- Weaker evidence: a New York Times analysis cited by Forbes estimated regular-season Chiefs games rose about 9% (late window) and 16% (early window) in the season Swift attended. The New York Post reported a record 58.8 million women watching LVIII in 2024 (47.5% of the audience, up 9%). Neither original data set was published, and LVIII also had overtime and a rematch.
PART 4: PENALTIES, REFEREES AND THE CHIEFS
REGULAR SEASON, 2016 TO 2026
- Method: every accepted penalty in regular-season games from 2016 through Week 7 of 2026 (about 31,000), excluding declined and offsetting penalties (about 3%). Penalty yards advantage = the opponent's penalty yards minus the team's own, per game. A plus means the other side was flagged more.
- The Chiefs get flagged more than their opponents: -7.2 penalty yards per game, 31st of 32 teams (6.4 penalties a game versus 6.1 for opponents). Only the Jets are worse.
- It happens on the road: -15.2 yards per game over 84 road games, the largest road gap in the league (New Orleans is next at -11.7). At home it is +0.5.
- Their penalties lean toward defense: pass interference is 10.4% of their penalties versus 8.2% for the league, and defensive holding 7.6% versus 6.0%.
- Teams really do differ: 9 of 32 teams have penalty gaps two or more standard errors from zero, where chance predicts only one or two. That points to team habits, not targeting. The best teams are Cincinnati (+7.9 per game), Indianapolis (+7.8) and Pittsburgh (+7.6).
- Penalties barely affect results: team-level penalty advantage and win percentage are essentially unrelated (correlation -0.08).
PLAYOFF PENALTIES, RANKED TEAM BY TEAM (2016 TO 2025 SEASONS)
- All 122 playoff games, 2016 to 2025 seasons. Every number is per game the team played, so teams that advance often are not inflated. League average: 4.7 accepted penalties and 39 penalty yards per team per playoff game.
- Playoff samples are noisy (a typical game swings about 33 yards), so the last column pulls each team toward zero in proportion to how few games it played: average x games / (games + 20). The ranking uses it. Teams marked * played fewer than 4 games. The Jets had no playoff games.
| 1 |  Vikings | 6 | 2.7 | 6.0 | +42.8 | +34.5 | +10.0 |
| 2 | Patriots | 15 | 3.4 | 5.1 | +12.7 | +9.0 | +5.5 |
| 3 | Chiefs | 23 | 4.7 | 6.0 | +10.2 | +16.0 | +5.5 |
| 4 |  Chargers | 5 | 4.6 | 5.8 | +25.4 | +15.0 | +5.1 |
| 5 |  Panthers * | 2 | 2.5 | 7.5 | +54.5 | +54.5 | +5.0 |
| 6 | Eagles | 16 | 5.2 | 5.0 | +8.7 | +16.0 | +3.9 |
| 7 |  Titans | 7 | 5.6 | 6.0 | +12.7 | +18.0 | +3.3 |
| 8 |  Broncos * | 3 | 2.3 | 3.7 | +16.3 | +18.0 | +2.2 |
| 9 |  Colts * | 3 | 4.7 | 5.3 | +12.7 | -3.0 | +1.7 |
| 10 | Buccaneers | 10 | 4.4 | 4.6 | +3.8 | -7.5 | +1.3 |
| 11 |  Browns * | 3 | 3.3 | 4.7 | +7.7 | +5.0 | +1.0 |
| 12 |  Raiders * | 2 | 7.5 | 7.0 | +6.0 | +6.0 | +0.6 |
| 13 |  Commanders | 4 | 3.8 | 5.0 | +3.2 | +2.0 | +0.5 |
| 14 |  Cardinals * | 1 | 6.0 | 6.0 | +8.0 | +8.0 | +0.4 |
| 15 |  Lions | 5 | 4.2 | 4.2 | -2.0 | +2.0 | -0.4 |
| 16 |  Packers | 12 | 4.5 | 4.1 | -1.3 | -4.0 | -0.5 |
| 17 |  Bears | 4 | 4.0 | 3.8 | -4.0 | -23.0 | -0.7 |
| 18 |  Cowboys | 7 | 6.3 | 4.7 | -2.6 | +0.0 | -0.7 |
| 19 |  Steelers | 9 | 4.2 | 3.8 | -2.3 | -5.0 | -0.7 |
| 20 | Falcons | 5 | 4.6 | 5.0 | -8.0 | -11.0 | -1.6 |
| 21 |  Giants * | 3 | 3.0 | 3.0 | -14.7 | -31.0 | -1.9 |
| 22 | Bengals | 7 | 5.6 | 3.9 | -7.4 | -16.0 | -1.9 |
| 23 |  Jaguars | 6 | 4.0 | 4.5 | -9.0 | +1.0 | -2.1 |
| 24 | Rams | 16 | 4.6 | 4.2 | -5.6 | -5.0 | -2.5 |
| 25 |  Dolphins * | 3 | 7.0 | 3.7 | -20.7 | -21.0 | -2.7 |
| 26 |  Bills | 16 | 4.0 | 3.9 | -7.5 | -15.5 | -3.4 |
| 27 | 49ers | 14 | 4.9 | 4.6 | -9.1 | -10.0 | -3.8 |
| 28 |  Saints | 7 | 5.9 | 5.3 | -14.7 | -26.0 | -3.8 |
| 29 | Seahawks | 10 | 5.9 | 4.1 | -12.4 | -9.5 | -4.2 |
| 30 |  Ravens | 9 | 5.6 | 4.7 | -16.7 | -33.0 | -5.2 |
| 31 |  Texans | 11 | 6.5 | 4.0 | -25.5 | -25.0 | -9.1 |
Click a column to sort. Click again to reverse it, and once more to go back to the original order.
- Chiefs: 3rd adjusted (+5.5 yards a game), 8th on the raw average (+10.2) over 23 games. They were flagged for 4.7 penalties a game versus 6.0 for opponents. The Patriots (+12.7) and Eagles (+8.7) have similar positive numbers over many games. None is significant on its own (the Chiefs' z-score is 1.5).
- Other end: Texans (-25.4 over 11 games, adjusted -9.1), Ravens (-16.7 over 9), Seahawks (-12.4 over 10).
- Small-sample leaders: Vikings (+42.8 over 6), Panthers (+54.5 over 2), Chargers (+25.4 over 5).
- Advancing more does not mean a better number: the link between games played and penalty advantage is slightly negative (-0.20, not significant). Most differences between teams look like noise, which fits no team getting steady help.
HOW BIG IS THE PENALTY ADVANTAGE? SMALL
- Measured over about 5,500 regular-season team-games: every 10 yards of penalty advantage is worth about 0.4 points of final margin (range 0.3 to 0.5), roughly 1% win probability.
- Vikings (+10 adjusted): about 0.4 points a game. Chiefs (+5.5 adjusted): about 0.2 points, or 0.6% win probability. Even the Chiefs' raw +10.2 is about 0.4 points. The Panthers' +54.5 would be about 2 points, but that is only 2 games.
- For comparison: home field is worth about 1.7 points in the same data, a missed field goal costs 3 points, and the typical betting line moves in half-point steps.
- Penalty yards explain under 1% of the difference between teams' scores in a typical game (r-squared 0.008).
- Single games can swing: teams with 40+ yards of penalty advantage won 55.6% and averaged +2.5 points; teams at -40 or worse won 44.1%. That overstates the effect, because the team ahead tends to be flagged less.
- Verdict: small, not statistically meaningful in the playoffs, and not game changing. No team has an edge worth more than about a point a game, and for most it is under half a point.
REFEREE CREWS ARE THE CLEAREST FACTOR
- Among the 23 crews with 40+ games, total accepted penalties per game run from 10.5 (Alan Eck) to 14.7 (Walt Anderson). The differences are far too large to be chance (p below 0.000001) and they hold up: a crew's average in even-numbered seasons predicts its average in odd-numbered seasons (correlation 0.59).
- The Chiefs' worst crews were Craig Wrolstad (-29 yards a game over 10 games), Brad Allen (-16 over 11) and Bill Vinovich (-13 over 11). The best were John Hussey (about even) and Clete Blakeman (-2). With 8 to 16 games each and about 8 crews checked, one extreme is expected. The Chiefs' spread across crews is typical (24th of 32).
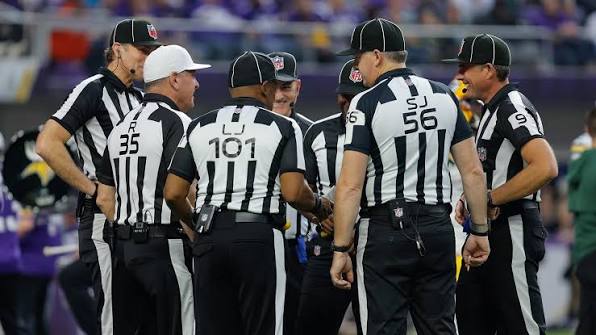
- Nothing meaningful for divisional games (11.9 penalties vs 12.3), primetime vs daytime (12.1 vs 12.1) or dome vs outdoor (12.0 vs 12.2). Home teams are flagged slightly less than road teams (5.9 vs 6.3 per game).
- For a given matchup, the crew is the factor to check: a high-flag crew like Anderson's or Hochuli's means about 2 to 4 more penalties than a low-flag crew.
SUMMARY IN PLAIN WORDS
- Are ratings going up every year because the NFL is more popular? Viewers are up about 3 million a year, but the share of homes watching is not. Most of the rise is counting changes (streaming, bars, a new Nielsen method) and more TV homes.
- Are games rigged to put big markets in the Super Bowl? No evidence. Teams lean a little big-market, but random drawing makes that happen about 1 time in 9. The five biggest markets were absent, the most frequent team (Kansas City) is a small market, and market size did not predict ratings.
- The one number to watch: conference championship games favored the bigger-market team more than the odds suggested (20 games). It came from checking several slices, so it is most likely chance. Ten years cannot prove nobody steers outcomes. They only show no pattern a fix would leave.
- Taylor Swift: probably helped, size unknown. Chiefs games drew more after she started attending, but the 2026 game without the Chiefs drew nearly the same.
- Penalties and the Chiefs: flagged more than opponents in the regular season, mostly on the road; per game in the playoffs, 3rd of 31 after adjusting, not significant.
- How big is a penalty edge? Ten yards is about 0.4 points (1% win probability). The best playoff team gets about 0.4 points a game. It is neither significant nor game changing.
- What drives ratings: the two overtime games rated highest; the two lowest were a close game and a blowout, so no simple rule fits. City matters much less than people think.
Ratings and viewer counts are not strictly comparable across years because Nielsen's method changed. Viewer counts are the headline Nielsen figures at the time (LVI, in 2022, is the NBC TV number, 99.2 million; 112.3 million with streaming).