College QB Top 25: Week 3
The 25 best quarterbacks in the country by what their plays were worth — now adjusted for who they played.
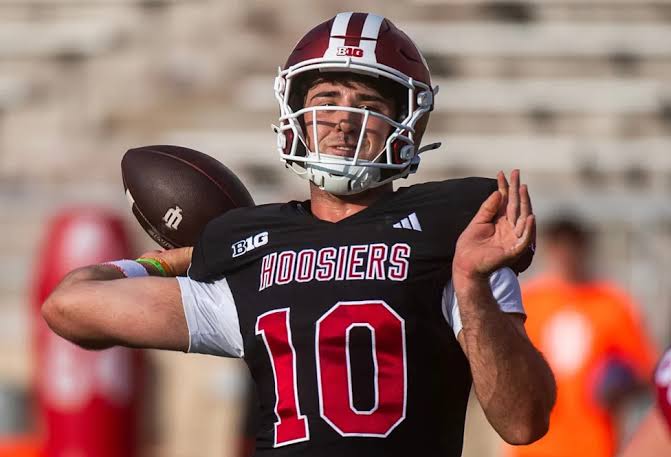
The 25 best quarterbacks in college football through Week 3, by what their plays were actually worth — now weighed against who they were playing.
What changed this week
The grade adjusts for opponent now. It didn't last week. Before a quarterback's numbers get pulled toward the national average for sample size, they're first moved up or down by how good the defense he faced actually was. Beat a bad defense and the game counts for a bit less; beat a good one and it counts for more.
That is a real change, not a relabelling, and the board moved accordingly. The three quarterbacks who fell furthest had all just played weak defenses — Rocco Becht went from 8th to 25th after Buffalo, Malachi Singleton 7th to 17th after Charlotte, Julian Sayin 17th to 24th after Kent State. Going the other way, Conner Weigman rose to 9th on the back of a Tough defense in Texas Tech, and three quarterbacks are on the board who weren't last week at all.
What the number means
Grade blends two things. How many points a quarterback's plays were worth per snap, and how often those plays gained enough to keep the drive on schedule. Efficiency carries the larger share; staying on schedule carries the rest. Both are measured against the national average, so zero is average and Darian Mensah at 2.35 is a long way above it.
Small samples still get pulled toward average. Three games is not much, and a quarterback with fifty dropbacks has his number dragged toward the middle in proportion to how little he has thrown.
The defense beside each last game is the same strength measure the adjustment uses — Tough, Average or Weak — shown so you can see what a number is built on rather than having to take it on faith. Two quarterbacks faced opponents with no rating at all.
Completion percentage is for color only. It's raw accuracy with no adjustment for how hard the throws were, and it doesn't feed the grade. Mensah's 88.7% is the highest here; it isn't why he's first.
Tiers reset every week, calculated fresh from that week's numbers rather than fixed bands.
The Top 25
| 1 | Darian Mensah | Miami | S | 2.35 | 0.65 | 62.9% | 88.7% | 72 | Wake Forest (Average) | ↓ |
| 2 | Jayden Maiava | USC | S | 2.07 | 0.61 | 60.1% | 75.0% | 114 | Rutgers (Weak) | ↓ |
| 3 | Aaron Philo | Florida | S | 2.07 | 0.66 | 57.5% | 75.8% | 64 | Auburn (Tough) | → |
| 4 | Josh Hoover | Indiana | S | 2.02 | 0.72 | 53.6% | 70.8% | 50 | Western Kentucky (Weak) | ↓ |
| 5 | Gunner Stockton | Georgia | S | 1.87 | 0.59 | 57.9% | 85.7% | 45 | Arkansas (Weak) | ↓ |
| 6 | Ryan Browne | Purdue | S | 1.85 | 0.61 | 56.9% | 73.5% | 104 | UCLA (Average) | ↑ |
| 7 | Ethan Grunkemeyer | Virginia Tech | S | 1.60 | 0.58 | 53.8% | 78.6% | 101 | Maryland (Average) | → |
| 8 | Aidan Chiles | Northwestern | S | 1.50 | 0.55 | 54.0% | 69.0% | 45 | Colorado (Average) | ↑ |
| 9 | Conner Weigman | Houston | S | 1.47 | 0.55 | 53.7% | 70.5% | 81 | Texas Tech (Tough) | ↓ |
| 10 | Bear Bachmeier | BYU | S | 1.46 | 0.51 | 55.6% | 71.7% | 62 | Colorado State (Average) | ↑ |
| 11 | C.J. Carr | Notre Dame | S | 1.39 | 0.52 | 53.6% | 72.2% | 73 | Michigan State (Average) | ↓ |
| 12 | Katin Houser | Illinois | S | 1.29 | 0.43 | 57.3% | 73.1% | 80 | Southern Illinois (unrated) | ↑ |
| 13 | Kevin Jennings | SMU | S | 1.25 | 0.53 | 50.6% | 73.1% | 55 | Louisville (Tough) | ↓ |
| 14 | Lincoln Kienholz | Louisville | S | 1.25 | 0.54 | 50.4% | 63.4% | 74 | SMU (Average) | → |
| 15 | Cutter Boley | Arizona State | S | 1.19 | 0.54 | 49.0% | 65.8% | 81 | Kansas (Average) | ↓ |
| 16 | Devon Dampier | Utah | A | 1.14 | 0.46 | 53.2% | 71.8% | 73 | Utah State (Weak) | ↓ |
| 17 | Malachi Singleton | App State | A | 1.09 | 0.48 | 50.6% | 75.3% | 95 | Charlotte (Weak) | ↓ |
| 18 | David McComb | Miami (OH) | A | 1.07 | 0.53 | 48.0% | 61.6% | 76 | Cincinnati (Average) | ↓ |
| 19 | Austin Simmons | Missouri | A | 1.05 | 0.53 | 47.1% | 67.7% | 66 | Troy (Average) | ↓ |
| 20 | Marcus Stokes | Memphis | A | 1.00 | 0.49 | 48.9% | 71.6% | 100 | UT Martin (unrated) | ↑ |
| 21 | Keelon Russell | Alabama | A | 0.99 | 0.44 | 51.1% | 73.1% | 56 | Florida State (Average) | ↑ |
| 22 | Avery Johnson | Kansas State | A | 0.98 | 0.45 | 50.7% | 71.2% | 80 | Tulane (Average) | → |
| 23 | Kenny Minchey | Kentucky | A | 0.98 | 0.49 | 48.5% | 63.6% | 71 | Texas A&M (Tough) | ↑ |
| 24 | Julian Sayin | Ohio State | A | 0.96 | 0.38 | 54.6% | 69.7% | 81 | Kent State (Weak) | ↓ |
| 25 | Rocco Becht | Penn State | A | 0.93 | 0.49 | 47.7% | 68.3% | 63 | Buffalo (Weak) | ↓ |
Click a column to sort. Click again to reverse it, and once more to go back to the original order.
Garbage time is stripped out. Passer identity comes from the official play-by-play text checked against the roster, covering about nine in ten pass plays nationally; the rest, mostly trick plays and unclear text, were left out rather than guessed at.