Week 3: Every FBS Team Ranked
All 138 teams, corrected. Opponent-adjusted efficiency does the heavy lifting, with per-play production and the betting market as seasoning. No polls.
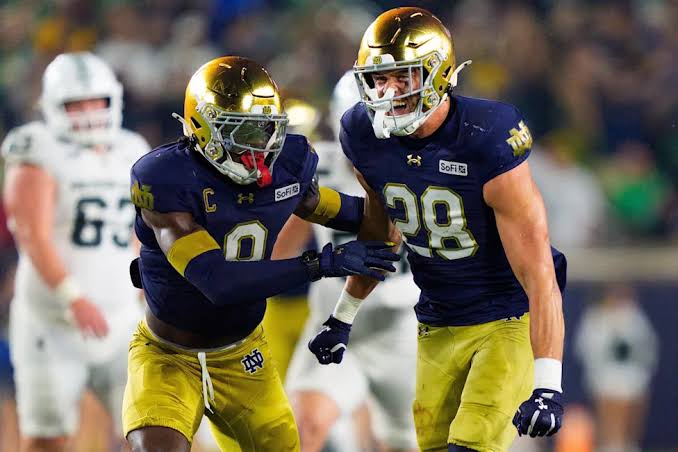
Every team that plays FBS football, ranked one through 138, through the games of Friday, Sept. 19.
What the number means
The rating is roughly how many points per game a team projects to beat an average FBS opponent by. Ohio State at +29.2 would be a four-touchdown favorite against that average team; UL Monroe at −27.3 would lose by about the same. The gap between any two teams is a rough spread: Georgia (+28.2) against Clemson (+3.8) comes out around twenty-four and a half.
Three ingredients go into one number. An opponent-adjusted efficiency rating does nearly all of the work, because it is the only one of the three that accounts for who a team has actually played — and in September that is the whole ballgame. Nobody has faced a representative schedule yet, so raw margins lie about who has been tested. Raw per-play production and the betting market are in there to catch what the adjusted rating misses, but they are seasoning, not the meal.
This is a corrected build, and the correction was real. An earlier version of this board leaned far too hard on the last two ingredients. A single blowout of an overmatched opponent, or nothing more than a decent preseason win total, was enough to lift a team thirty spots above its actual level of play. Two service academies sitting in the top 40 on 1-1 records was the tell. That is fixed, and the teams it flattered have moved to where they belong.
No poll touches any of this. Not the AP, not the coaches. How the three ingredients are weighted against each other is a judgment call, and it is ours — we are not publishing the dial settings.
Off and Def are national ranks, one to 138, not ratings. Off 1 is the best offense in the country, Def 1 the best defense. They come from the on-field blend only, with no market component, because odds do not split by side of the ball. They show where a rating comes from — Oklahoma is 16th overall behind the No. 2 defense despite the 53rd offense, while USC has the best offense in the country and sits 9th because the defense ranks 40th.
All 138
| 1 | Ohio State | +29.2 | 4 | 1 |
| 2 | Georgia | +28.2 | 2 | 5 |
| 3 | Indiana | +26.3 | 7 | 3 |
| 4 | Notre Dame | +26.1 | 5 | 6 |
| 5 | Miami | +23.2 | 8 | 8 |
| 6 | Oregon | +23.0 | 6 | 12 |
| 7 | Texas | +22.7 | 9 | 10 |
| 8 | LSU | +19.8 | 28 | 4 |
| 9 | USC | +19.6 | 1 | 40 |
| 10 | Tennessee | +19.4 | 3 | 34 |
| 11 | Alabama | +18.8 | 20 | 9 |
| 12 | Penn State | +18.4 | 13 | 13 |
| 13 | Florida | +17.6 | 19 | 15 |
| 14 | Texas Tech | +17.1 | 16 | 20 |
| 15 | BYU | +16.8 | 12 | 17 |
| 16 | Oklahoma | +16.5 | 53 | 2 |
| 17 | Texas A&M | +16.3 | 14 | 18 |
| 18 | Iowa | +16.1 | 38 | 7 |
| 19 | Utah | +15.8 | 15 | 19 |
| 20 | Ole Miss | +14.8 | 10 | 49 |
| 21 | Michigan | +14.1 | 43 | 11 |
| 22 | Missouri | +13.7 | 33 | 14 |
| 23 | Kansas State | +12.9 | 18 | 29 |
| 24 | Nebraska | +12.6 | 21 | 26 |
| 25 | Louisville | +12.3 | 17 | 44 |
| 26 | Washington | +12.0 | 44 | 16 |
| 27 | South Carolina | +11.9 | 31 | 28 |
| 28 | Mississippi State | +11.9 | 11 | 57 |
| 29 | Virginia Tech | +11.3 | 22 | 37 |
| 30 | SMU | +10.6 | 24 | 46 |
| 31 | Auburn | +10.0 | 54 | 22 |
| 32 | Houston | +9.9 | 23 | 50 |
| 33 | Virginia | +9.6 | 50 | 23 |
| 34 | TCU | +9.2 | 36 | 27 |
| 35 | Illinois | +8.8 | 25 | 52 |
| 36 | Pittsburgh | +8.5 | 41 | 33 |
| 37 | North Dakota State | +8.4 | 48 | 24 |
| 38 | Vanderbilt | +7.9 | 30 | 54 |
| 39 | UCLA | +7.8 | 27 | 55 |
| 40 | Arizona | +7.7 | 33 | 43 |
| 41 | Maryland | +6.9 | 45 | 47 |
| 42 | Northwestern | +6.7 | 59 | 30 |
| 43 | Oklahoma State | +6.3 | 47 | 48 |
| 44 | Cincinnati | +6.3 | 29 | 62 |
| 45 | James Madison | +6.1 | 51 | 38 |
| 46 | Boise State | +5.4 | 37 | 59 |
| 47 | Duke | +5.2 | 32 | 63 |
| 48 | Baylor | +4.9 | 39 | 61 |
| 49 | Iowa State | +4.8 | 76 | 25 |
| 50 | Kentucky | +4.6 | 57 | 45 |
| 51 | Minnesota | +3.8 | 71 | 35 |
| 52 | Clemson | +3.8 | 80 | 31 |
| 53 | UCF | +3.7 | 75 | 32 |
| 54 | New Mexico | +3.7 | 72 | 39 |
| 55 | Wisconsin | +3.5 | 90 | 21 |
| 56 | Florida State | +3.4 | 46 | 71 |
| 57 | Arizona State | +3.2 | 67 | 42 |
| 58 | North Carolina | +2.7 | 84 | 36 |
| 59 | NC State | +2.6 | 40 | 72 |
| 60 | West Virginia | +2.6 | 52 | 67 |
| 61 | Wake Forest | +2.4 | 66 | 56 |
| 62 | Kansas | +2.0 | 62 | 58 |
| 63 | Army | +2.0 | 60 | 75 |
| 64 | Memphis | +1.7 | 26 | 99 |
| 65 | Georgia Tech | +1.5 | 61 | 60 |
| 66 | South Florida | +1.3 | 42 | 80 |
| 67 | UTSA | +0.1 | 55 | 96 |
| 68 | Air Force | -0.0 | 73 | 77 |
| 69 | Michigan State | -0.1 | 69 | 64 |
| 70 | Fresno State | -0.2 | 106 | 41 |
| 71 | California | -0.7 | 64 | 73 |
| 72 | Tulsa | -0.7 | 81 | 70 |
| 73 | Western Michigan | -1.1 | 104 | 53 |
| 74 | Syracuse | -1.2 | 93 | 51 |
| 75 | Jacksonville State | -1.4 | 65 | 90 |
| 76 | Liberty | -1.4 | 78 | 87 |
| 77 | Colorado | -2.2 | 83 | 69 |
| 78 | Navy | -2.7 | 63 | 91 |
| 79 | Toledo | -2.8 | 94 | 76 |
| 80 | Arkansas | -2.9 | 49 | 108 |
| 81 | UNLV | -3.4 | 79 | 98 |
| 82 | Oregon State | -3.6 | 88 | 74 |
| 83 | UConn | -3.9 | 85 | 89 |
| 84 | Louisiana | -4.3 | 77 | 106 |
| 85 | Miami (OH) | -4.3 | 100 | 82 |
| 86 | Purdue | -4.3 | 58 | 105 |
| 87 | San Diego State | -4.4 | 102 | 68 |
| 88 | Rutgers | -4.7 | 56 | 111 |
| 89 | App State | -4.9 | 89 | 93 |
| 90 | Troy | -5.0 | 97 | 85 |
| 91 | Old Dominion | -5.3 | 118 | 66 |
| 92 | Texas State | -5.6 | 35 | 134 |
| 93 | Hawai'i | -5.9 | 95 | 102 |
| 94 | Colorado State | -6.2 | 96 | 83 |
| 95 | Washington State | -6.3 | 111 | 65 |
| 96 | Delaware | -6.3 | 87 | 107 |
| 97 | Temple | -6.4 | 68 | 119 |
| 98 | Tulane | -6.6 | 103 | 81 |
| 99 | East Carolina | -6.8 | 105 | 78 |
| 100 | Boston College | -6.9 | 99 | 79 |
| 101 | Florida Atlantic | -7.1 | 74 | 122 |
| 102 | Georgia Southern | -7.6 | 98 | 94 |
| 103 | Louisiana Tech | -7.7 | 101 | 97 |
| 104 | Arkansas State | -8.5 | 91 | 116 |
| 105 | North Texas | -8.8 | 70 | 127 |
| 106 | Coastal Carolina | -9.2 | 92 | 112 |
| 107 | Stanford | -9.6 | 108 | 88 |
| 108 | Nevada | -9.7 | 117 | 86 |
| 109 | Marshall | -9.9 | 82 | 131 |
| 110 | Utah State | -10.5 | 110 | 95 |
| 111 | Kennesaw State | -10.6 | 109 | 109 |
| 112 | South Alabama | -11.0 | 86 | 129 |
| 113 | Ohio | -11.6 | 122 | 100 |
| 114 | Florida International | -11.7 | 113 | 103 |
| 115 | Central Michigan | -12.7 | 129 | 92 |
| 116 | San José State | -13.1 | 123 | 101 |
| 117 | Wyoming | -13.8 | 133 | 84 |
| 118 | New Mexico State | -14.3 | 119 | 114 |
| 119 | Sam Houston | -14.5 | 114 | 115 |
| 120 | Buffalo | -14.8 | 130 | 104 |
| 121 | Rice | -15.0 | 124 | 110 |
| 122 | Missouri State | -16.2 | 120 | 123 |
| 123 | UAB | -16.6 | 112 | 125 |
| 124 | Georgia State | -16.7 | 107 | 136 |
| 125 | Middle Tennessee | -17.1 | 121 | 126 |
| 126 | Massachusetts | -17.2 | 125 | 113 |
| 127 | Eastern Michigan | -17.7 | 127 | 121 |
| 128 | Southern Miss | -18.6 | 116 | 130 |
| 129 | Western Kentucky | -18.8 | 115 | 135 |
| 130 | Akron | -19.2 | 131 | 118 |
| 131 | Sacramento State | -19.5 | 134 | 120 |
| 132 | Northern Illinois | -19.9 | 135 | 117 |
| 133 | UTEP | -20.5 | 126 | 128 |
| 134 | Bowling Green | -22.6 | 138 | 124 |
| 135 | Ball State | -23.9 | 132 | 132 |
| 136 | Charlotte | -23.9 | 128 | 137 |
| 137 | Kent State | -24.4 | 136 | 133 |
| 138 | UL Monroe | -27.3 | 137 | 138 |
Click a column to sort. Click again to reverse it, and once more to go back to the original order.