The Vikings Pressure the Quarterback on 4 of Every 10 Dropbacks, the Giants Can't Touch Anybody, and the Hurry Is the Stat Everybody Forgets
Sacks are only the tip of it. We ranked all 32 defenses by sacks, hits and hurries combined, and the list holds some surprises about who is really getting to the quarterback, and why it still does not tell you who has the best defense.
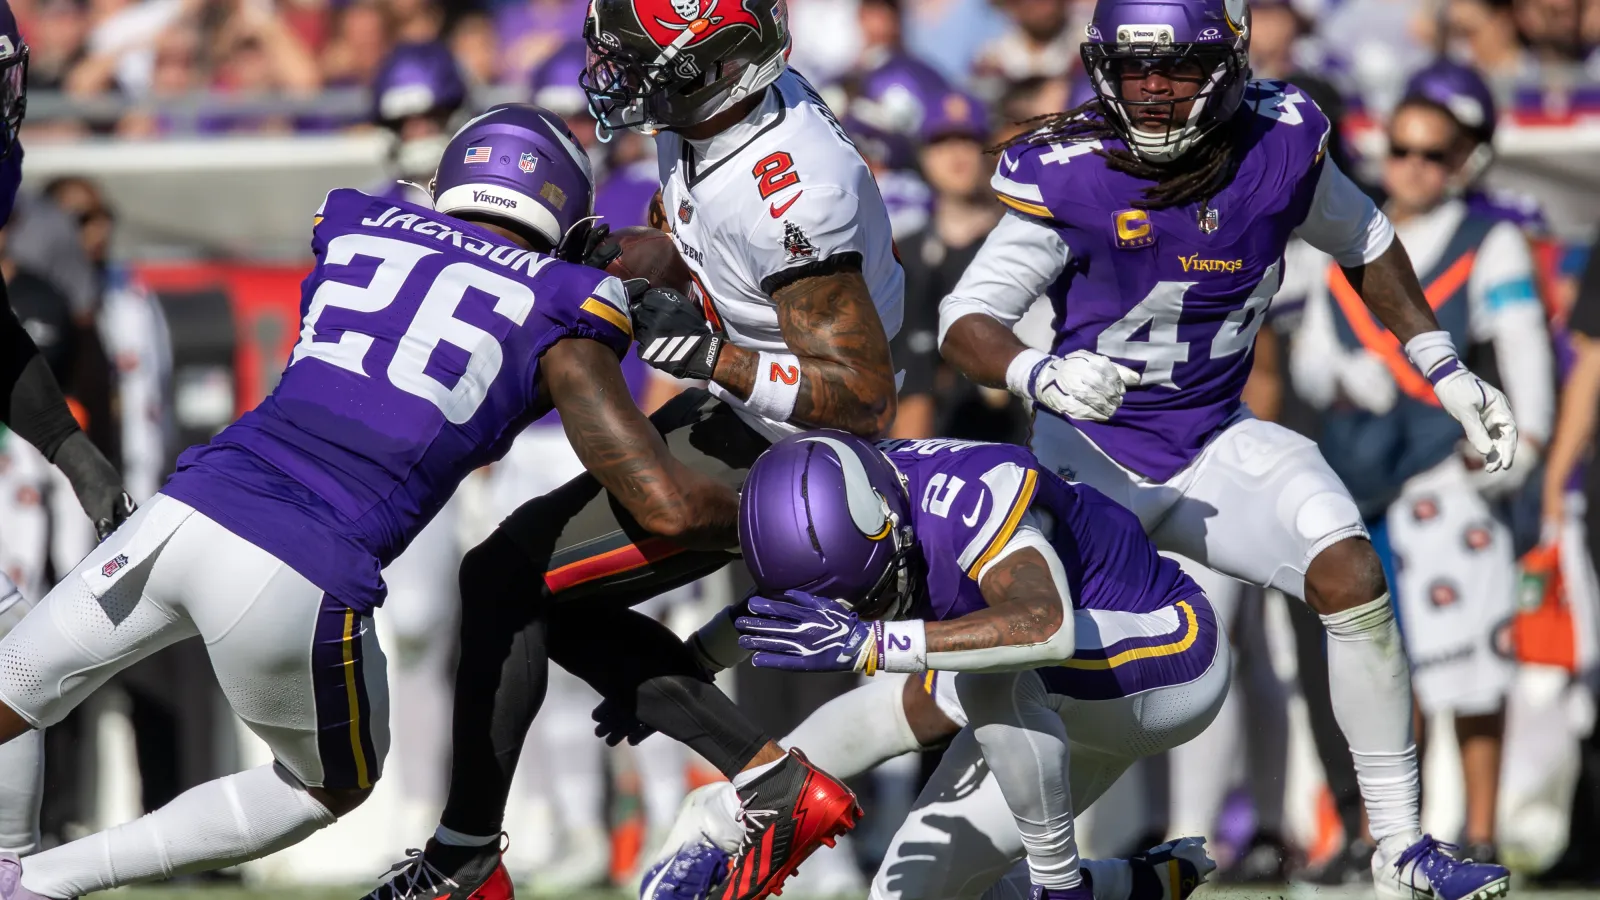
Sacks get the highlights. Hits get the replays. But the thing that actually ruins a quarterback's day most often is the hurry: the throw that comes out half a second early, the step up the pocket that was not there, the checkdown he did not want. So we ranked every defense in the league by all three, sacks, hits and hurries, through three weeks. A few teams at the top are exactly who you would guess. A few in the middle are not.
How we measured it
Pressure rate is total pressures divided by how many times the other team dropped back to pass. A pressure is a sack, a hit or a hurry. Sacks are the official team totals, and hits and hurries come from hand charting. Everything covers entire games, so garbage time is in there. Because hurries are charted by hand, two charters might not agree on every one. It is the best public number we have, not a perfect one.
The top five
1.  Minnesota Vikings: 40.6 percent
2.  Las Vegas Raiders: 36.3 percent
3.  Carolina Panthers: 32.8 percent
4.  Chicago Bears: 32.7 percent
5.  Washington Commanders: 31.9 percent
The Vikings are the kings
Minnesota pressured the quarterback 54 times on 133 dropbacks, with 14 sacks, 17 hits and 23 hurries. No one else is close. A big reason is that they bring five or more rushers on 75 percent of dropbacks, the most in the league by a mile. They are not sneaking up on anybody. They are just sending everyone, every time, and it is working.
The hurry tells a different story
Some teams do not collect many sacks and are still living in the quarterback's face. Carolina has 7 sacks but 23 hurries, which puts them third in the league. Chicago has 7 sacks and 19 hurries and ranks fourth. Washington has 5 sacks and 21 hurries and ranks fifth. Those three teams rank in the top five in pressure, and if you only looked at sacks you would never know it.
The reverse case is  Denver. The Broncos have 18 hits, which is great, but only 2 charted hurries all season, and that puts them 19th. That is an odd split, and it might say as much about the charting as about the defense, so hold that one loosely.
The quiet ones
Three teams get real pressure without sending the house.  Cincinnati blitzes just 17 percent of the time and sits 8th.
 Seattle blitzes 20 percent and sits 6th. Las Vegas blitzes 23 percent and sits 2nd. That is pressure from the front four, and it is the kind you can lean on week after week because it does not depend on a trick.
The bottom five
32.  New York Giants: 10.6 percent
31.  Indianapolis Colts: 16.2 percent
30.  Philadelphia Eagles: 17.3 percent
29.  Miami Dolphins: 18.5 percent
28.  Cleveland Browns: 19.3 percent
The Giants have 11 total pressures in 104 dropbacks, and exactly one sack. Only the Colts, at 16.2 percent, are also below 17 percent, and the Eagles at 17.3 percent are next. Miami is a story of its own: zero sacks, but 15 pressures, so they are getting close and not finishing. The rankings at the bottom are packed tightly, so a couple of games could shuffle them.
The full list, 1 to 32
| 1 |  Minnesota Vikings | 40.6% | 54 | 133 | 14 | 17 | 23 |
| 2 |  Las Vegas Raiders | 36.3% | 41 | 113 | 10 | 16 | 15 |
| 3 |  Carolina Panthers | 32.8% | 38 | 116 | 7 | 8 | 23 |
| 4 |  Chicago Bears | 32.7% | 32 | 98 | 7 | 6 | 19 |
| 5 |  Washington Commanders | 31.9% | 37 | 116 | 5 | 11 | 21 |
| 6 |  Seattle Seahawks | 30.6% | 33 | 108 | 7 | 15 | 11 |
| 7 |  Buffalo Bills | 29.0% | 36 | 124 | 9 | 16 | 11 |
| 8 |  Cincinnati Bengals | 28.6% | 38 | 133 | 10 | 11 | 17 |
| 9 |  Green Bay Packers | 25.7% | 27 | 105 | 7 | 6 | 14 |
| 10 |  San Francisco 49ers | 25.5% | 28 | 110 | 6 | 12 | 10 |
| 11 |  Atlanta Falcons | 25.0% | 34 | 136 | 5 | 17 | 12 |
| 12 |  Los Angeles Chargers | 24.5% | 25 | 102 | 7 | 14 | 4 |
| 13 |  Jacksonville Jaguars | 24.5% | 24 | 98 | 8 | 9 | 7 |
| 14 |  New Orleans Saints | 23.9% | 28 | 117 | 7 | 12 | 9 |
| 15 |  Detroit Lions | 23.8% | 35 | 147 | 12 | 11 | 12 |
| 16 |  Pittsburgh Steelers | 23.7% | 22 | 93 | 8 | 8 | 6 |
| 17 |  New York Jets | 23.4% | 25 | 107 | 8 | 7 | 10 |
| 18 |  New England Patriots | 23.1% | 24 | 104 | 7 | 11 | 6 |
| 19 |  Denver Broncos | 23.0% | 28 | 122 | 8 | 18 | 2 |
| 20 |  Tennessee Titans | 22.3% | 21 | 94 | 6 | 7 | 8 |
| 21 |  Arizona Cardinals | 22.2% | 20 | 90 | 4 | 6 | 10 |
| 22 |  Houston Texans | 21.8% | 24 | 110 | 11 | 8 | 5 |
| 23 |  Tampa Bay Buccaneers | 21.7% | 23 | 106 | 6 | 8 | 9 |
| 24 |  Dallas Cowboys | 20.6% | 20 | 97 | 2 | 9 | 9 |
| 25 |  Los Angeles Rams | 20.6% | 22 | 107 | 3 | 10 | 9 |
| 26 |  Kansas City Chiefs | 20.4% | 22 | 108 | 4 | 8 | 10 |
| 27 |  Baltimore Ravens | 19.3% | 23 | 119 | 6 | 12 | 5 |
| 28 |  Cleveland Browns | 19.3% | 22 | 114 | 7 | 9 | 6 |
| 29 |  Miami Dolphins | 18.5% | 15 | 81 | 0 | 8 | 7 |
| 30 |  Philadelphia Eagles | 17.3% | 17 | 98 | 3 | 5 | 9 |
| 31 |  Indianapolis Colts | 16.2% | 18 | 111 | 7 | 6 | 5 |
| 32 |  New York Giants | 10.6% | 11 | 104 | 1 | 5 | 5 |
Click a column to sort. Click again to reverse it, and once more to go back to the original order.
Pressure counts include whole games and are not adjusted for garbage time.
Now the twist: pressure is not the same as good defense
Here is the part that matters. Across all 32 teams, more pressure goes with fewer points allowed per pass play, but only moderately. The link is about minus 0.37. And hurries on their own are almost unrelated to how many points a defense gives up.
Carolina and Washington rank 3rd and 5th in pressure, and they still give up 0.147 and 0.222 expected points per dropback, below average in both cases. Washington is also blitzing on nearly half of its snaps. Pressure did not save them.  Jacksonville is only 13th in pressure and has the best pass defense in football by expected points allowed, at minus 0.177.
 Kansas City is 26th in pressure and gives up exactly zero. Miami, 29th in pressure, has the worst pass defense in the league at plus 0.575, and
 Arizona, 21st in pressure, is next at plus 0.422, because getting to the quarterback does nothing when the coverage behind it falls apart. Chicago shows the other side: fourth in pressure and second-best against the pass at minus 0.155, so when the rush and the coverage both work, you can see it.
A pass rush is a tool. Coverage is the other half. You need both.
What to watch
If a team is high in pressure and low in results, ask where the rest of the defense is. Carolina and Washington are the cleanest examples. If a team is low in pressure and high in results, like Kansas City, ask whether it can last. Three games is three games. A couple of bounces can move any of these numbers. But the early read holds up: the defenses you can trust are the ones that get pressure and cover, not the ones that do only one.
2026 regular season, Weeks 1 through 3. Pressure counts include whole games; blitz rate and expected points allowed have garbage time removed.