NFL Week 4 Advanced Stats: Every Sunday Game and the Full 32-Team Power Rankings
Technical report. Week 4 Sunday, October 4, 2026. 14 games. 2026 regular season only, garbage time removed.
Every table sorts: click a column header, click again to reverse it, and once more to go back to the original order.
Fourteen games from Sunday, Oct. 4. The game-by-game sections below cover those Sunday games only; the power rankings table includes all 16 games, Monday night's Falcons at Saints included. Every number below is from the 2026 regular season, with garbage time removed from the rate stats unless a column says "all."
Bottom line
Seven teams were flattered by their result: Colts, Eagles, Titans, 49ers, Lions, Giants, Bills. Seven played better than the result shows: Commanders, Rams, Ravens, Broncos, Panthers, Cardinals, Patriots. Seattle-Chargers is flagged as a disagreement between the competitive-snap and all-snap views.
Biggest gaps: Colts +10.5 points flattered, Eagles +8.0 flattered, Commanders -10.5 understated, Rams -8.0 understated. San Francisco ranks #1 on the opponent-adjusted composite, Seattle #2, the Rams #3.
How to read this report
EPA (Expected Points Added): the points a play is worth compared with the typical outcome from the same down, distance and field position. EPA/play is the average. Off EPA/play is a team's own offense; Def EPA/play allowed is the opponent's offense against that team (lower is better for the defense).
Success %: the share of plays that gained enough to keep the offense on schedule.
CPOE (Completion Percentage Over Expected): completion rate compared with what the difficulty of the throws predicts. Positive is better. Two independently built models measure it: the play-by-play model used throughout, and a player-tracking model shown as "tracking CPOE."
Pass EPA/db: EPA per dropback. A dropback includes sacks.
Net yds and Y/P: net yards (sack yards subtracted) and net yards per play on passes and runs.
Explosive %: the share of plays gaining 20+ yards on a pass or 10+ on a run.
Giveaways: interceptions plus lost fumbles. 3rd down is conversions/attempts.
Garbage time removed: plays after a game is effectively decided are left out of every rate stat except columns labeled "all."
The Gap: each team's net EPA is converted to the point margin it normally produces. Gap = actual margin minus that implied margin, so positive means the result flattered the team and negative means the team played better than the result shows. It is computed on competitive plays and on all plays, and a team is flagged only when both agree in sign and both exceed 2 points. Each team played one game, so treat single-game gaps as direction, not precision.
Power rating: a composite of net yards-per-play differential, net EPA per play, pass EPA and explosive-play rate, each adjusted for opponent, on competitive plays from Weeks 1-4. Adj Off/Def EPA are the opponent-adjusted EPA per play (higher is better for both). Prior rank is the same model run through Week 3, so it can differ from the order published in last week's report.
QB-availability flag: no passer has thrown more than 85% of the team's attempts this season, so the rating blends quarterbacks.
Data note: charted data (drops, QB-fault sacks, blitzes) for Sunday's games wasn't available yet, so the charted section shows Weeks 1-3 season-to-date tendencies. Injuries are the official Week 4 final designations; no post-game injury is asserted beyond them. Coaching lines are directional flags, not grades. Samples are four games.
1. Scoreboard vs. play-by-play
 Colts | +17 | +5.6 | +11.4 | +7.4 | +9.6 | +10.5 | Flattered |
 Eagles | -4 | -9.0 | +5.0 | -15.0 | +11.0 | +8.0 | Flattered |
 Titans | -6 | -17.2 | +11.2 | -9.5 | +3.5 | +7.3 | Flattered |
 49ers | +10 | +2.3 | +7.7 | +3.3 | +6.7 | +7.2 | Flattered |
 Lions | -6 | -13.0 | +7.0 | -8.3 | +2.3 | +4.6 | Flattered |
 Giants | +12 | +8.2 | +3.8 | +7.6 | +4.4 | +4.1 | Flattered |
 Bills | -3 | -6.9 | +3.9 | -6.4 | +3.4 | +3.6 | Flattered |
 Chargers | -7 | -20.5 | +13.5 | +0.6 | -7.6 | +2.9 | Disagree/noise |
 Jets | -11 | -14.0 | +3.0 | -11.3 | +0.3 | +1.7 | Disagree/noise |
 Jaguars | +5 | +4.7 | +0.3 | +2.8 | +2.2 | +1.2 | Disagree/noise |
 Texans | -4 | -5.4 | +1.4 | -5.0 | +1.0 | +1.2 | Disagree/noise |
 Packers | +3 | +2.6 | +0.4 | +2.4 | +0.6 | +0.5 | Disagree/noise |
 Raiders | -3 | -5.5 | +2.5 | -1.3 | -1.7 | +0.4 | Disagree/noise |
 Vikings | +5 | +5.3 | -0.3 | +4.3 | +0.7 | +0.2 | Disagree/noise |
 Dolphins | -5 | -5.3 | +0.3 | -4.3 | -0.7 | -0.2 | Disagree/noise |
 Chiefs | +3 | +5.5 | -2.5 | +1.3 | +1.7 | -0.4 | Disagree/noise |
 Buccaneers | -3 | -2.6 | -0.4 | -2.4 | -0.6 | -0.5 | Disagree/noise |
 Cowboys | +4 | +5.4 | -1.4 | +5.0 | -1.0 | -1.2 | Disagree/noise |
 Bengals | -5 | -4.7 | -0.3 | -2.8 | -2.2 | -1.2 | Disagree/noise |
 Bears | +11 | +14.0 | -3.0 | +11.3 | -0.3 | -1.7 | Disagree/noise |
 Seahawks | +7 | +20.5 | -13.5 | -0.6 | +7.6 | -2.9 | Disagree/noise |
 Patriots | +3 | +6.9 | -3.9 | +6.4 | -3.4 | -3.6 | Understated |
 Cardinals | -12 | -8.2 | -3.8 | -7.6 | -4.4 | -4.1 | Understated |
 Panthers | +6 | +13.0 | -7.0 | +8.3 | -2.3 | -4.6 | Understated |
 Broncos | -10 | -2.3 | -7.7 | -3.3 | -6.7 | -7.2 | Understated |
 Ravens | +6 | +17.2 | -11.2 | +9.5 | -3.5 | -7.3 | Understated |
 Rams | +4 | +9.0 | -5.0 | +15.0 | -11.0 | -8.0 | Understated |
 Commanders | -17 | -5.6 | -11.4 | -7.4 | -9.6 | -10.5 | Understated |
- Commanders
- Rams
- Ravens
- Broncos
- Panthers
- Cardinals
- Patriots
- Seahawks
- Bears
- Bengals
- Cowboys
- Buccaneers
- Chiefs
- Dolphins
- Vikings
- Raiders
- Packers
- Texans
- Jaguars
- Jets
- Chargers
- Bills
- Giants
- Lions
- 49ers
- Titans
- Eagles
- Colts
Points the result differed from what the play-by-play (EPA) supported. Negative (green): the result looked worse than the team played. Positive (red): the result looked better than the team played. Gray: the two measures disagree, or the gap is noise.
2. Game by game, all 14 games
 Colts at
 Commanders: 30-13
Final IND 30, WAS 13 · Site: London (neutral)
Verdict: FLATTERED: Colts
| Colts | 30 | 64 | 260 | 4.06 | 5/15 | 2 | 2 | -0.062 | -0.208 | 42.4 | -0.392 | -6.1 | 6.8 |
| Commanders | 13 | 64 | 317 | 4.95 | 2/16 | 1 | 2 | -0.208 | -0.062 | 27.1 | -0.198 | -10.2 | 10.4 |
Indianapolis won by 17 on 4.06 net yards a play, fewer than Washington's 4.95. The Colts' passing game was a negative -0.39 EPA per dropback (Daniel Jones: 19 of 34 for 143 yards) and they converted 5 of 15 third downs. They won because Washington went 2 for 16 on third down. Jayden Daniels was out, Marcus Mariota left with a reported knee injury after five dropbacks, and rookie Athan Kaliakmanis (CPOE minus 11.8) played the rest. The scoreboard says blowout; the play-by-play says the margin the EPA supports is about 6 points. Result-vs-play gap: IND +11.4 (competitive plays) / +9.6 (all plays).
Official Out/Doubtful: Colts: none listed Out/Doubtful. Commanders: Sam Cosmi (G, Out); Rachaad White (RB, Out); Nick Cross (S, Out); Jayden Daniels (QB, Out).
 Titans at
 Ravens: 18-24
Final TEN 18, BAL 24 · Site: M&T Bank Stadium
Verdict: UNDERSTATED: Ravens / FLATTERED: Titans
| Titans | 18 | 63 | 299 | 4.75 | 2/10 | 2 | 1 | -0.112 | +0.362 | 38.0 | -0.059 | +5.3 | 6.0 |
| Ravens | 24 | 62 | 386 | 6.23 | 2/11 | 0 | 2 | +0.362 | -0.112 | 50.0 | +0.490 | +12.1 | 15.8 |
Baltimore averaged 0.36 EPA a play and 6.23 net yards a play against Tennessee's 4.75, and still won by only 6. Lamar Jackson was 15 of 20 for 222 yards and 2 TDs with a CPOE of +11.3 before leaving at halftime with a reported ankle injury, so most of Baltimore's competitive snaps came with him in the game. Baltimore went 2 for 11 on third down and Tennessee turned it over 2 times. A game that should have been decided stayed close. Gap: BAL -11.2 / -3.5.
Official Out/Doubtful: Titans: none listed Out/Doubtful. Ravens: Ethan Pocic (C, Out); Trey Hendrickson (LB, Out); Jovaughn Gwyn (C, Out).
 Patriots at
 Bills: 29-26
Final NE 29, BUF 26 · Site: Highmark Stadium
Verdict: EVEN, slight edge Patriots
| Patriots | 29 | 74 | 409 | 5.53 | 5/13 | 2 | 1 | +0.191 | +0.109 | 51.4 | +0.363 | +1.1 | 8.1 |
| Bills | 26 | 59 | 340 | 5.76 | 6/13 | 2 | 1 | +0.109 | +0.191 | 40.7 | +0.106 | +10.3 | 13.6 |
A coin flip on both measures: New England 0.19 EPA a play and 0.514 success rate to Buffalo's 0.11 and 0.407. NE ran 74 plays to Buffalo's 59. Drake Maye threw 3 TDs with 1 INT (CPOE +1.1); Josh Allen's CPOE was +10.3 but his success rate on dropbacks was only 34.3 percent. Gap: NE -3.9 / -3.4, so a 3-point win is slightly smaller than the play deserved.
Official Out/Doubtful: Patriots: Christian Barmore (DT, Out); Brenden Schooler (S, Out); Christian Gonzalez (CB, Out). Bills: T.J. Sanders (DE, Doubtful).
 Jets at
 Bears: 12-23
Final NYJ 12, CHI 23 · Site: Soldier Field
Verdict: NO MIRAGE: Bears were better
| Jets | 12 | 32 | 157 | 4.91 | 0/7 | 0 | 3 | -0.340 | +0.087 | 36.7 | -0.667 | -21.2 | 3.3 |
| Bears | 23 | 90 | 495 | 5.50 | 7/17 | 2 | 1 | +0.087 | -0.340 | 60.9 | +0.246 | +13.6 | 10.9 |
Chicago's backup quarterback Tyson Bagent (Caleb Williams out) posted +0.25 pass EPA with a CPOE of +13.6 on competitive plays, and the Bears ran 90 plays for 495 yards to the Jets' 32 for 157. The Jets were 0 for 7 on third down and took 3 sacks. Net EPA per play: Chicago +0.427. The 11-point margin is what the data says, even with Breece Hall, Adonai Mitchell and Mason Taylor out for New York.
Official Out/Doubtful: Jets: Dylan Parham (G, Out); Breece Hall (RB, Out); Adonai Mitchell (WR, Out); Francisco Mauigoa (LB, Out); Mason Taylor (TE, Out). Bears: Cam Lewis (S, Doubtful); Braxton Jones (T, Out); Kyler Gordon (CB, Out); Noah Sewell (LB, Out); Caleb Williams (QB, Out); Shemar Turner (DE, Out).
 Jaguars at
 Bengals: 22-17
Final JAX 22, CIN 17 · Site: Paycor Stadium
Verdict: EVEN, Jaguars on efficiency
| Jaguars | 22 | 59 | 325 | 5.51 | 5/12 | 0 | 4 | +0.128 | +0.029 | 41.4 | +0.247 | +12.3 | 10.3 |
| Bengals | 17 | 76 | 437 | 5.75 | 5/14 | 2 | 2 | +0.029 | +0.128 | 45.9 | +0.102 | +9.0 | 4.1 |
Cincinnati had the volume (76 plays, 437 yards, 5.75 a play) but Jacksonville had the efficiency (0.13 EPA a play to 0.03). Joe Burrow went 39 of 54 for 428 yards, but with 2 INTs. The 5-point margin matches the EPA-implied margin within a point: no luck adjustment needed.
Official Out/Doubtful: Jaguars: none listed Out/Doubtful. Bengals: Kyle Dugger (S, Out); Colbie Young (WR, Out).
 Cowboys at
 Texans: 34-30
Final DAL 34, HOU 30 · Site: Reliant Stadium
Verdict: EVEN, shootout
| Cowboys | 34 | 78 | 399 | 5.12 | 5/15 | 0 | 3 | +0.203 | +0.185 | 46.2 | +0.275 | +3.3 | 7.7 |
| Texans | 30 | 53 | 397 | 7.49 | 3/9 | 0 | 2 | +0.185 | +0.203 | 47.2 | +0.425 | +15.1 | 15.1 |
Dallas 34, Houston 30, essentially level on EPA (0.20 vs 0.18). Houston averaged 7.49 net yards a play on 53 plays; C.J. Stroud's CPOE of +15.1 is the best of any quarterback with 20 or more dropbacks this week. Dallas kept the ball (78 plays), and Dak Prescott had a +3.3 CPOE. Neither team turned it over. Houston is 0-4 on a profile that looks much better than the record.
Official Out/Doubtful: Cowboys: Cobie Durant (CB, Out); DeMarvion Overshown (LB, Out). Texans: M.J. Stewart (S, Out); Azeez Al-Shaair (LB, Out).
 Cardinals at
 Giants: 24-36
Final ARI 24, NYG 36 · Site: MetLife Stadium
Verdict: FLATTERED: Giants (low bar)
| Cardinals | 24 | 66 | 270 | 4.09 | 4/13 | 3 | 2 | -0.206 | -0.065 | 45.5 | -0.365 | -3.1 | 6.1 |
| Giants | 36 | 67 | 321 | 4.79 | 7/15 | 3 | 4 | -0.065 | -0.206 | 34.3 | +0.156 | +1.3 | 7.5 |
Both offenses were poor: Giants -0.06 EPA a play, Cardinals -0.21. Each team gave it away 3 times. The Giants won by 12 on 7 of 15 on third down; Jacoby Brissett threw 3 INTs and the Cardinals' pass EPA was -0.36 per dropback. Jameis Winston had 3 TDs and 2 INTs with a success rate of just 38.2 percent. Gap: NYG +3.8 / +4.4: the 12-point final is about 4 points more than the play justified.
Official Out/Doubtful: Cardinals: Dadrion Taylor-Demerson (S, Out). Giants: none listed Out/Doubtful.
 Rams at
 Eagles: 24-20
Final LA 24, PHI 20 · Site: Lincoln Financial Field
Verdict: FLATTERED: Eagles / UNDERSTATED: Rams
| Rams | 24 | 83 | 416 | 5.01 | 7/16 | 2 | 1 | +0.004 | -0.176 | 48.8 | +0.007 | -3.1 | 4.9 |
| Eagles | 20 | 61 | 172 | 2.82 | 0/13 | 0 | 4 | -0.176 | +0.004 | 35.7 | -0.017 | -16.4 | 1.8 |
The most lopsided game on tape that finished as a 4-point game. Philadelphia gained 172 net yards on 61 plays (2.82 a play), did not convert any of its 13 third-down snaps, and took 4 sacks. Jalen Hurts was 12 of 27 for 93 yards (CPOE minus 18.5). The Rams ran 83 plays for 416 yards. Full-game EPA implied roughly a 15-point Rams win. The Eagles were without Dallas Goedert, DeVonta Smith, Marquise Brown, Zack Baun and Fred Johnson; the Rams without Aaron Donald. Gap: PHI +5.0 / +11.0.
Official Out/Doubtful: Rams: Aaron Donald (DT, Out); Jaylen Watson (CB, Out); Terrance Ferguson (TE, Out). Eagles: Dallas Goedert (TE, Out); Fred Johnson (T, Out); Marcus Epps (S, Out); Marquise Brown (WR, Out); Zack Baun (LB, Out); DeVonta Smith (WR, Out).
 Packers at
 Buccaneers: 17-14
Final GB 17, TB 14 · Site: Raymond James Stadium
Verdict: EVEN
| Packers | 17 | 57 | 295 | 5.18 | 2/11 | 2 | 0 | +0.013 | -0.035 | 45.6 | +0.231 | +5.3 | 5.3 |
| Buccaneers | 14 | 62 | 275 | 4.44 | 5/12 | 2 | 3 | -0.035 | +0.013 | 45.2 | -0.072 | +1.2 | 4.8 |
A 3-point game that finished as a 3-point game on the data (net EPA per play +0.048 for Green Bay). Tampa Bay played without Baker Mayfield; Jalon Daniels was 19 of 27 for 148 yards with 2 INTs and a pass EPA of -0.07 per dropback. Green Bay's run game was a negative -0.31 EPA a carry, so neither team moved the ball with authority. Tampa Bay is 0-4 but was not outplayed here.
Official Out/Doubtful: Packers: Aaron Banks (G, Out); Jacob Monk (C, Out); Warren Brinson (DT, Out); Anthony Campbell (DT, Out). Buccaneers: Baker Mayfield (QB, Out); Ko Kieft (TE, Out); Benjamin Morrison (CB, Out); Rueben Bain Jr. (LB, Out).
 Dolphins at
 Vikings: 10-15
Final MIA 10, MIN 15 · Site: U.S. Bank Stadium
Verdict: EVEN, low-event
| Dolphins | 10 | 39 | 198 | 5.08 | 2/9 | 1 | 2 | -0.240 | -0.046 | 33.3 | -0.530 | -12.3 | 7.7 |
| Vikings | 15 | 75 | 341 | 4.55 | 8/17 | 0 | 4 | -0.046 | -0.240 | 40.5 | -0.071 | +7.6 | 8.1 |
Miami ran only 39 plays for 198 yards (Malik Willis 9 of 17 for 85 yards, CPOE minus 12.3). Minnesota moved the ball unspectacularly (4.55 a play) and was 8 for 17 on third down. Justin Jefferson was out. The 5-point win is the margin the EPA gives them.
Official Out/Doubtful: Dolphins: Rob Beal Jr. (LB, Out); Storm Duck (CB, Out); Caleb Douglas (WR, Out). Vikings: Justin Jefferson (WR, Out); Charles Demmings (CB, Out).
 Chiefs at
 Raiders: 30-27
Final KC 30, LV 27 · Site: Allegiant Stadium
Verdict: EVEN
| Chiefs | 30 | 60 | 400 | 6.67 | 5/13 | 0 | 2 | +0.127 | +0.019 | 43.3 | +0.063 | -7.3 | 13.3 |
| Raiders | 27 | 81 | 439 | 5.42 | 5/16 | 1 | 0 | +0.019 | +0.127 | 48.0 | +0.184 | -5.7 | 9.3 |
Kansas City won by 3 on 6.67 net yards a play (400 on 60 plays) against Las Vegas's 5.42 on 81. Patrick Mahomes was 15 of 31 for 225 yards with a CPOE of minus 7.3 (tracking CPOE: minus 6.4), so the Chiefs won through the run game (K. Walker 22 carries, 177 yards) and explosive plays (13.3 percent of plays). The two gap measures disagree (KC -2.5 vs +1.7), so no luck flag.
Official Out/Doubtful: Chiefs: Josh Simmons (T, Out). Raiders: Jackson Powers-Johnson (G, Out).
 Chargers at
 Seahawks: 23-30
Final LAC 23, SEA 30 · Site: Lumen Field
Verdict: DISAGREEMENT: Seahawks dominated competitive snaps; Chargers padded the final
| Chargers | 23 | 71 | 301 | 4.24 | 5/15 | 3 | 4 | -0.494 | +0.020 | 31.1 | -0.710 | -12.0 | 8.9 |
| Seahawks | 30 | 58 | 288 | 4.97 | 3/12 | 1 | 3 | +0.020 | -0.494 | 46.2 | -0.094 | +6.5 | 15.4 |
On competitive plays Seattle's defense allowed -0.49 EPA a play and Seattle's offense posted 0.02; Los Angeles went -0.71 per dropback. Justin Herbert's competitive-snap EPA per dropback was minus 0.81 and his CPOE minus 11.3; across all snaps, including garbage time, it improves to minus 0.23 and minus 3.9. Seattle took 3 takeaways. The all-play measure shows this as an even game, so the two views disagree (SEA -13.5 vs +7.6): the 7-point final understates Seattle's control, but only the garbage-time snaps are keeping the Chargers close in the full-game number. Zach Charbonnet and Jadarian Price were out for Seattle.
Official Out/Doubtful: Chargers: Dalvin Tomlinson (DT, Out); Kayode Awosika (G, Out); Charlie Kolar (TE, Out); Brenen Thompson (WR, Out). Seahawks: Zach Charbonnet (RB, Out); Jadarian Price (RB, Out).
 Broncos at
 49ers: 14-24
Final DEN 14, SF 24 · Site: Levi's Stadium
Verdict: FLATTERED: 49ers / UNDERSTATED: Broncos
| Broncos | 14 | 67 | 298 | 4.45 | 8/17 | 0 | 0 | +0.085 | +0.123 | 41.7 | +0.173 | -1.1 | 3.3 |
| 49ers | 24 | 63 | 360 | 5.71 | 6/13 | 0 | 0 | +0.123 | +0.085 | 49.2 | +0.300 | -0.4 | 11.1 |
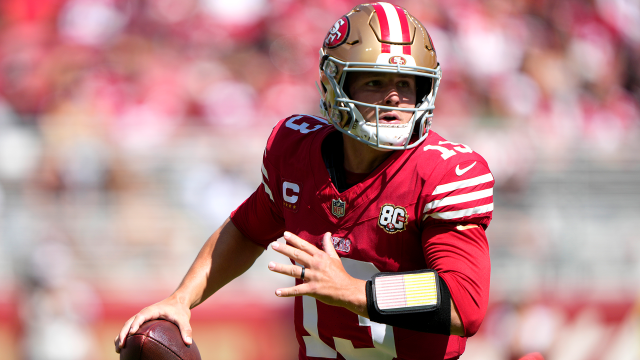
San Francisco won by 10 with a net EPA per play of only +0.037. Denver ran 67 plays for 298 yards to the 49ers' 63 for 360 (4.45 vs 5.71 a play); neither team gave it away or took a sack. Brock Purdy's 29-throw line (19 for 218, 2 TDs) looks cleaner than his CPOE of minus 0.4 (tracking CPOE: minus 5.0). The 49ers did it without Nick Bosa, Mykel Williams or James Thompson Jr. Gap: SF +7.7 / +6.7.
Official Out/Doubtful: Broncos: Dondrea Tillman (LB, Out). 49ers: Nick Bosa (DE, Out); Mykel Williams (DE, Out); James Thompson Jr. (DT, Out).
 Lions at
 Panthers: 26-32
Final DET 26, CAR 32 · Site: Bank of America Stadium
Verdict: UNDERSTATED: Panthers / FLATTERED: Lions
| Lions | 26 | 71 | 452 | 6.37 | 4/12 | 0 | 1 | +0.141 | +0.353 | 43.8 | +0.244 | -6.9 | 6.2 |
| Panthers | 32 | 73 | 449 | 6.15 | 5/12 | 0 | 3 | +0.353 | +0.141 | 52.2 | +0.554 | +17.4 | 11.9 |
Bryce Young was 29 of 41 for 329 yards, with a CPOE of +17.4 on competitive plays; Carolina's net EPA per play was +0.212 and the Panthers had 0 giveaways. Detroit's Jared Goff threw 52 times for 412 yards but his CPOE on competitive plays was minus 6.9. The result, a 6-point Carolina win, is smaller than the play (-7.0 / -2.3). T. McMillan caught 14 of 15 targets for 192 yards and 2 TDs.
Official Out/Doubtful: Lions: Ben Bartch (G, Out). Panthers: Damien Lewis (G, Out); Xavier Legette (WR, Out).
3. Quarterbacks
Sunday starters with 15 or more dropbacks. Dropbacks include sacks; Att excludes them.
| B.Young | CAR | 44 | 29 | 41 | 329 | 2 | 0 | 3 | +0.466 | +0.582 | +9.0 | +17.4 | +8.5 | 2.67 | 17.1 |
| L.Jackson | BAL | 22 | 15 | 20 | 222 | 2 | 0 | 2 | +0.534 | +0.534 | +11.3 | +11.3 | +9.6 | 3.01 | 10.0 |
| C.Stroud | HOU | 31 | 21 | 29 | 347 | 2 | 0 | 2 | +0.482 | +0.482 | +15.1 | +15.1 | +14.3 | 3.15 | 22.6 |
| T.Lawrence | JAX | 28 | 18 | 24 | 227 | 1 | 0 | 4 | +0.332 | +0.379 | +12.3 | +12.3 | +5.7 | 2.48 | 13.0 |
| D.Maye | NE | 39 | 22 | 38 | 269 | 3 | 1 | 1 | +0.283 | +0.283 | +1.1 | +1.1 | -2.3 | 3.05 | 16.2 |
| B.Purdy | SF | 29 | 19 | 29 | 218 | 2 | 0 | 0 | +0.279 | +0.279 | -0.4 | -0.4 | -5.0 | 2.96 | 16.7 |
| J.Love | GB | 30 | 22 | 30 | 197 | 2 | 1 | 0 | +0.230 | +0.230 | +5.3 | +5.3 | +1.6 | 2.43 | 6.7 |
| J.Goff | DET | 53 | 32 | 52 | 412 | 1 | 0 | 1 | +0.233 | +0.229 | -1.8 | -6.9 | -6.2 | 2.84 | 9.6 |
| T.Bagent | CHI | 35 | 25 | 34 | 268 | 0 | 1 | 1 | +0.227 | +0.219 | +8.0 | +13.6 | +9.1 | 2.84 | 20.6 |
| D.Prescott | DAL | 48 | 32 | 45 | 335 | 1 | 0 | 3 | +0.205 | +0.205 | +3.3 | +3.3 | +4.7 | 2.83 | 24.4 |
| B.Nix | DEN | 42 | 25 | 42 | 214 | 1 | 0 | 0 | +0.112 | +0.173 | -4.0 | -1.1 | -8.8 | 3.02 | 2.4 |
| K.Cousins | LV | 50 | 31 | 50 | 365 | 2 | 1 | 0 | +0.196 | +0.139 | -3.0 | -5.7 | +1.5 | 3.28 | 13.5 |
| J.Burrow | CIN | 56 | 39 | 54 | 428 | 1 | 2 | 2 | +0.132 | +0.121 | +9.8 | +9.0 | +8.1 | 2.64 | 14.8 |
| J.Winston | NYG | 34 | 18 | 30 | 250 | 3 | 2 | 4 | +0.114 | +0.114 | +1.3 | +1.3 | -1.1 | 2.88 | 17.2 |
| J.Allen | BUF | 35 | 23 | 34 | 253 | 1 | 1 | 1 | +0.078 | +0.078 | +10.3 | +10.3 | +3.7 | 2.83 | 12.1 |
| P.Mahomes | KC | 33 | 15 | 31 | 225 | 2 | 0 | 2 | +0.053 | +0.053 | -7.3 | -7.3 | -6.4 | 3.04 | 20.0 |
| M.Stafford | LA | 52 | 32 | 51 | 317 | 0 | 2 | 1 | +0.021 | +0.003 | -2.5 | -3.1 | +0.0 | 2.83 | 23.5 |
| K.Murray | MIN | 41 | 27 | 37 | 247 | 0 | 0 | 4 | -0.016 | -0.016 | +7.6 | +7.6 | +3.9 | 3.03 | 5.4 |
| J.Hurts | PHI | 31 | 12 | 27 | 93 | 2 | 0 | 4 | -0.263 | -0.101 | -18.5 | -16.4 | -10.9 | 3.08 | 11.1 |
| J.Daniels | TB | 30 | 19 | 27 | 148 | 1 | 2 | 3 | -0.144 | -0.144 | +1.2 | +1.2 | +3.9 | 2.82 | 11.1 |
| S.Darnold | SEA | 25 | 13 | 22 | 168 | 2 | 1 | 3 | -0.207 | -0.150 | +0.3 | +6.5 | +5.4 | 3.34 | 31.8 |
| A.Kaliakmanis | WAS | 34 | 15 | 33 | 186 | 1 | 1 | 1 | -0.300 | -0.215 | -11.8 | -14.4 | -7.4 | 3.04 | 33.3 |
| C.Ward | TEN | 33 | 20 | 32 | 222 | 1 | 1 | 1 | -0.086 | -0.227 | +6.8 | +5.3 | -2.3 | 3.16 | 9.7 |
| D.Jones | IND | 36 | 19 | 34 | 143 | 0 | 1 | 2 | -0.371 | -0.392 | -5.2 | -6.1 | -9.9 | 2.54 | 2.9 |
| J.Brissett | ARI | 37 | 21 | 35 | 166 | 2 | 3 | 2 | -0.491 | -0.491 | -3.1 | -3.1 | +8.3 | 2.53 | 45.7 |
| M.Willis | MIA | 19 | 9 | 17 | 85 | 0 | 0 | 2 | -0.653 | -0.653 | -12.3 | -12.3 | -12.0 | 3.48 | 17.6 |
| G.Smith | NYJ | 18 | 8 | 15 | 119 | 1 | 0 | 3 | -0.270 | -0.667 | -11.4 | -21.2 | -7.3 | 2.95 | 13.3 |
| J.Herbert | LAC | 35 | 19 | 31 | 189 | 1 | 2 | 4 | -0.229 | -0.814 | -3.9 | -11.3 | -3.1 | 2.66 | 16.1 |
Looked better than they were
- Brock Purdy (SF): the counting line looks clean (19 of 29, 218 yds, 2 TD, 0 sacks), but CPOE is -0.4 and tracking CPOE puts it at -5.0 against an expected completion rate of 68.3%.
- Justin Herbert (LAC): EPA per dropback is -0.81 on competitive snaps versus -0.23 across all snaps; CPOE -11.3 vs -3.9. Garbage-time snaps padded the line.
- Jared Goff (DET): 412 yards on 52 attempts (7.9 yds/att) with a competitive-snap CPOE of -6.9 and a 6-point loss; volume, not efficiency.
- Patrick Mahomes (KC): 15 of 31 for 225 yards, CPOE -7.3 (tracking -6.4); the win came from the run game and explosive plays.
- Kirk Cousins (LV): 365 yards on 50 attempts, competitive-snap CPOE -5.7.
Looked worse than they were
- C.J. Stroud (HOU): CPOE +15.1 (tracking +14.3), 0 turnovers, 7.49 net yards a play, in a 4-point loss that leaves Houston 0-4.
- Bryce Young (CAR): CPOE +17.4 on competitive snaps (tracking +8.5); 0 giveaways; the 6-point win is smaller than the play.
- Tyson Bagent (CHI): starting for Caleb Williams: +0.25 pass EPA per dropback, CPOE +13.6 on competitive snaps; the 0 TD / 1 INT line hides it.
- Joe Burrow (CIN): CPOE +9.0 (tracking +8.1) on 428 yards; the two INTs and a loss mask an efficient day.
- Kyler Murray (MIN): 0 TD and 4 sacks, but CPOE +7.6 and 0 giveaways.
4. Skill players
Competitive plays, 7 or more targets.
Yardage that flattered
- Mi. Wilson (ARI): 13 targets, 7 catches, 95 yards, -0.72 EPA per target: volume without efficiency.
- C. Brown (CIN): 10 of 10 for 72 yards, 86% of it after the catch, 0.00 EPA per target.
- A. Jeanty (LV): 5 catches on 7 targets for 62 yards, 94% of it after the catch, -0.11 EPA per target; 15 carries at -0.19 EPA each.
- I. Likely (NYG): 12 targets, 7 catches, 66 yards, -0.32 EPA per target.
Efficiency the box score hid
- N. Collins (HOU): 7 of 8 for 118 yards and 2 TDs: +1.18 EPA per target in a loss.
- J. Williams (DET): 6 of 8 for 102 yards: +0.89 EPA per target in a loss.
- T. Hockenson (MIN): 13 of 13 for 119 yards: +0.87 EPA per target.
- Z. Flowers (BAL): 7 of 8 for 124 yards, 1 TD: +1.01 EPA per target.
5. Charted data: sacks, drops and pass rush (Weeks 1-3)
Season-to-date through Week 3 for all 32 teams. Sunday's Week 4 charting wasn't available yet.
| Cardinals | 132 | 4 | 5 | 0 | 4 | 22 | 4.23 | 4 | 10 |
 Falcons | 98 | 1 | 7 | 1 | 3 | 22 | 4.20 | 5 | 24 |
| Ravens | 99 | 3 | 5 | 0 | 3 | 37 | 4.50 | 6 | 20 |
| Bills | 112 | 3 | 8 | 3 | 8 | 31 | 4.31 | 9 | 27 |
| Panthers | 138 | 2 | 7 | 0 | 18 | 37 | 4.38 | 7 | 14 |
| Bears | 122 | 4 | 6 | 0 | 7 | 41 | 4.64 | 7 | 13 |
| Bengals | 115 | 3 | 7 | 2 | 1 | 15 | 4.06 | 10 | 21 |
 Browns | 112 | 3 | 9 | 3 | 4 | 22 | 4.18 | 7 | 16 |
| Cowboys | 126 | 5 | 3 | 3 | 4 | 28 | 4.32 | 2 | 12 |
| Broncos | 109 | 3 | 5 | 1 | 7 | 38 | 4.43 | 8 | 26 |
| Lions | 124 | 4 | 7 | 4 | 1 | 35 | 4.48 | 12 | 23 |
| Packers | 140 | 7 | 8 | 3 | 3 | 35 | 4.38 | 7 | 14 |
| Texans | 145 | 1 | 10 | 0 | 8 | 23 | 4.31 | 11 | 18 |
| Colts | 111 | 4 | 6 | 0 | 4 | 23 | 4.19 | 7 | 13 |
| Jaguars | 93 | 5 | 4 | 1 | 5 | 30 | 4.33 | 8 | 15 |
| Chiefs | 114 | 3 | 4 | 0 | 7 | 31 | 4.39 | 4 | 10 |
| Rams | 127 | 6 | 5 | 0 | 5 | 27 | 4.33 | 3 | 13 |
| Chargers | 115 | 5 | 8 | 0 | 3 | 25 | 4.25 | 7 | 20 |
| Raiders | 108 | 5 | 5 | 2 | 6 | 21 | 4.22 | 10 | 25 |
| Dolphins | 118 | 2 | 9 | 4 | 0 | 32 | 4.36 | 0 | 9 |
| Vikings | 96 | 1 | 9 | 1 | 5 | 72 | 4.94 | 14 | 34 |
| Patriots | 113 | 2 | 9 | 0 | 4 | 41 | 4.61 | 7 | 18 |
 Saints | 155 | 4 | 10 | 2 | 7 | 29 | 4.33 | 7 | 19 |
| Giants | 95 | 2 | 7 | 2 | 1 | 27 | 4.32 | 1 | 7 |
| Jets | 126 | 5 | 9 | 0 | 4 | 34 | 4.46 | 8 | 13 |
| Eagles | 110 | 1 | 8 | 7 | 8 | 27 | 4.29 | 3 | 8 |
 Steelers | 135 | 8 | 8 | 1 | 7 | 27 | 4.27 | 8 | 17 |
| Seahawks | 107 | 4 | 3 | 0 | 2 | 21 | 4.25 | 7 | 21 |
| 49ers | 95 | 3 | 0 | 0 | 3 | 26 | 4.27 | 6 | 17 |
| Buccaneers | 132 | 6 | 13 | 5 | 4 | 46 | 4.67 | 6 | 14 |
| Titans | 104 | 1 | 5 | 3 | 8 | 21 | 4.23 | 6 | 12 |
| Commanders | 125 | 5 | 3 | 0 | 7 | 47 | 4.58 | 5 | 17 |
6. Coaching and coordinator flags
Directional only, not graded. Chicago went for it on 8 of 10 short-yardage mid-field fourth downs through Week 4, Denver 0 of 5, Jacksonville 0 of 2. Cincinnati and Carolina are the most pass-heavy offenses relative to expectation on early downs; Atlanta, the Giants and Tennessee the most run-heavy. Minnesota's defense leads in pressure; Philadelphia and the Giants generate the least. Defensive samples are small in October.
| Cardinals | 3/8 | 38% | -0.4 | 18.1 |
| Falcons | 1/4 | 25% | -13.0 | 18.8 |
| Ravens | 3/4 | 75% | -6.2 | 17.4 |
| Bills | 3/5 | 60% | -0.3 | 22.9 |
| Panthers | 5/7 | 71% | +7.1 | 14.0 |
| Bears | 8/10 | 80% | -3.3 | 23.8 |
| Bengals | 2/7 | 29% | +7.2 | 21.7 |
| Browns | 2/5 | 40% | +6.1 | 22.1 |
| Cowboys | 2/3 | 67% | +2.5 | 14.5 |
| Broncos | 0/5 | 0% | -2.5 | 21.7 |
| Lions | 1/3 | 33% | +1.7 | 24.7 |
| Packers | 5/9 | 56% | -0.4 | 21.7 |
| Texans | 5/12 | 42% | -1.1 | 24.7 |
| Colts | 5/11 | 45% | -4.6 | 17.9 |
| Jaguars | 0/2 | 0% | +0.4 | 21.3 |
| Chiefs | 6/8 | 75% | +3.4 | 14.6 |
| Rams | 3/4 | 75% | +3.6 | 17.4 |
| Chargers | 1/7 | 14% | -9.5 | 24.6 |
| Raiders | 5/7 | 71% | -2.1 | 28.6 |
| Dolphins | 2/3 | 67% | -6.4 | 18.3 |
| Vikings | 3/4 | 75% | -8.5 | 33.8 |
| Patriots | 4/9 | 44% | +0.7 | 19.8 |
| Saints | 2/6 | 33% | +3.2 | 20.0 |
| Giants | 1/3 | 33% | -10.6 | 11.7 |
| Jets | 3/5 | 60% | -1.2 | 14.6 |
| Eagles | 3/5 | 60% | -8.8 | 10.9 |
| Steelers | 2/4 | 50% | +3.9 | 23.1 |
| Seahawks | 4/6 | 67% | -2.7 | 25.4 |
| 49ers | 2/4 | 50% | +4.5 | 15.6 |
| Buccaneers | 2/6 | 33% | -4.4 | 15.5 |
| Titans | 2/8 | 25% | -10.6 | 19.7 |
| Commanders | 3/7 | 43% | -2.5 | 19.7 |
7. Power rankings through Week 4
Includes all 16 Week 4 games, Monday night included.
Opponent-adjusted, garbage time removed. Remaining SOS rank: 1 is the hardest remaining schedule by opponents' composite.
- 49ers
- Seahawks*
- Rams
- Ravens
- Bears*
- Chiefs
- Jaguars
- Bills
- Patriots
- Panthers
- Texans
- Giants*
- Steelers
- Cowboys
- Buccaneers*
- Colts
- Dolphins
- Titans
- Chargers
- Cardinals
Composite rating in standard deviations from average (opponent-adjusted, garbage time removed). * QB-availability flag: no passer has thrown more than 85% of the team's attempts, so the rating blends quarterbacks.
| 1 | 49ers | 4-0 | +2.10 | +0.142 | -0.033 | 1 | 0 | at SEA | 10 | - |
| 2 | Seahawks | 3-1 | +2.00 | +0.003 | +0.089 | 2 | 0 | vs SF | 1 | QB-availability |
| 3 | Rams | 2-2 | +1.52 | +0.003 | +0.042 | 3 | 0 | vs BUF | 9 | - |
| 4 | Ravens | 3-1 | +1.30 | +0.073 | +0.013 | 6 | +2 | at ATL | 27 | - |
| 5 | Bears | 3-1 | +1.25 | +0.044 | +0.055 | 7 | +2 | at GB | 14 | QB-availability |
| 6 | Chiefs | 4-0 | +1.22 | +0.076 | +0.008 | 5 | -1 | BYE | 5 | - |
| 7 | Jaguars | 3-1 | +1.00 | +0.060 | +0.057 | 8 | +1 | vs PHI | 32 | - |
| 8 | Bills | 3-1 | +0.88 | +0.078 | -0.049 | 4 | -4 | at LA | 6 | - |
| 9 | Patriots | 2-2 | +0.72 | +0.009 | +0.030 | 11 | +2 | vs LV | 17 | - |
| 10 | Panthers | 2-2 | +0.59 | +0.055 | -0.027 | 14 | +4 | BYE | 19 | - |
| 11 | Raiders | 3-1 | +0.34 | +0.025 | +0.026 | 9 | -2 | at NE | 4 | - |
| 12 | Falcons | 2-2 | +0.33 | -0.034 | +0.048 | 20 | +8 | vs BAL | 7 | QB-availability |
| 13 | Broncos | 2-2 | +0.28 | +0.003 | +0.025 | 13 | 0 | at LAC | 15 | - |
| 14 | Bengals | 2-2 | +0.11 | +0.044 | -0.009 | 12 | -2 | at MIA | 22 | - |
| 15 | Vikings | 4-0 | +0.03 | -0.064 | +0.111 | 15 | 0 | at NO | 8 | QB-availability |
| 16 | Packers | 2-2 | -0.01 | -0.027 | -0.034 | 17 | +1 | vs CHI | 12 | - |
| 17 | Jets | 1-3 | -0.08 | -0.029 | +0.011 | 10 | -7 | vs CLE | 16 | - |
| 18 | Browns | 3-1 | -0.35 | -0.011 | +0.004 | 19 | +1 | at NYJ | 25 | - |
| 19 | Eagles | 2-2 | -0.61 | -0.046 | -0.023 | 21 | +2 | at JAX | 26 | - |
| 20 | Commanders | 1-3 | -0.63 | -0.033 | -0.004 | 25 | +5 | vs NYG | 21 | QB-availability |
| 21 | Lions | 2-2 | -0.67 | +0.026 | -0.087 | 18 | -3 | at ARI | 24 | - |
| 22 | Saints | 1-3 | -0.72 | -0.026 | -0.043 | 16 | -6 | vs MIN | 28 | - |
| 23 | Texans | 0-4 | -0.75 | -0.034 | -0.021 | 27 | +4 | at TEN | 30 | - |
| 24 | Giants | 3-1 | -0.80 | -0.053 | +0.016 | 29 | +5 | at WAS | 23 | QB-availability |
| 25 | Steelers | 2-2 | -0.83 | -0.031 | +0.000 | 28 | +3 | vs IND | 20 | - |
| 26 | Cowboys | 2-2 | -0.87 | +0.095 | -0.094 | 22 | -4 | vs TB | 18 | - |
| 27 | Buccaneers | 0-4 | -1.08 | -0.094 | +0.035 | 26 | -1 | at DAL | 13 | QB-availability |
| 28 | Colts | 2-2 | -1.12 | -0.040 | -0.009 | 30 | +2 | at PIT | 31 | - |
| 29 | Dolphins | 0-4 | -1.15 | -0.036 | -0.065 | 32 | +3 | vs CIN | 11 | - |
| 30 | Titans | 0-4 | -1.30 | -0.057 | -0.049 | 24 | -6 | vs HOU | 29 | - |
| 31 | Chargers | 0-4 | -1.32 | -0.118 | +0.010 | 23 | -8 | vs DEN | 2 | - |
| 32 | Cardinals | 1-3 | -1.38 | -0.001 | -0.034 | 31 | -1 | vs DET | 3 | - |
8. Schedule, rest and injuries going into Week 5
| 2026-10-08 | TB at DAL | AT&T Stadium | 4/4 | short week, both teams; QB-availability flag: TB |
| 2026-10-11 | PHI at JAX | London (Tottenham) | 7/7 | international, 9:30 a.m. ET kickoff |
| 2026-10-11 | CIN at MIA | Hard Rock Stadium | 7/7 | - |
| 2026-10-11 | LV at NE | Gillette Stadium | 7/7 | - |
| 2026-10-11 | MIN at NO | Caesars Superdome | 7/6 | rest edge MIN (+1 days); QB-availability flag: MIN |
| 2026-10-11 | CLE at NYJ | MetLife Stadium | 10/7 | rest edge CLE (+3 days) |
| 2026-10-11 | IND at PIT | Acrisure Stadium | 7/10 | rest edge PIT (+3 days) |
| 2026-10-11 | HOU at TEN | Nissan Stadium | 7/7 | - |
| 2026-10-11 | NYG at WAS | Northwest Stadium | 7/7 | QB-availability flag: NYG, WAS |
| 2026-10-11 | CHI at GB | Lambeau Field | 7/7 | QB-availability flag: CHI |
| 2026-10-11 | DEN at LAC | SoFi Stadium | 7/7 | - |
| 2026-10-11 | DET at ARI | State Farm Stadium | 7/7 | - |
| 2026-10-11 | SF at SEA | Lumen Field | 7/7 | QB-availability flag: SEA |
| 2026-10-11 | BAL at ATL | Mercedes-Benz Stadium | 7/6 | rest edge BAL (+1 days); QB-availability flag: ATL |
| 2026-10-12 | BUF at LA | SoFi Stadium | 8/8 | - |
Quarterbacks out per the official Week 4 report: Caleb Williams (Bears), Baker Mayfield (Buccaneers), Jayden Daniels (Commanders); Aidan O'Connell (Raiders) questionable for a personal matter. Week 5 reports publish Wednesday.
Official Out/Doubtful designations, Week 4
| Cardinals | Dadrion Taylor-Demerson (S, Out) |
| Falcons | none listed Out/Doubtful |
| Ravens | Ethan Pocic (C, Out); Trey Hendrickson (LB, Out); Jovaughn Gwyn (C, Out) |
| Bills | T.J. Sanders (DE, Doubtful) |
| Panthers | Damien Lewis (G, Out); Xavier Legette (WR, Out) |
| Bears | Cam Lewis (S, Doubtful); Braxton Jones (T, Out); Kyler Gordon (CB, Out); Noah Sewell (LB, Out); Caleb Williams (QB, Out); Shemar Turner (DE, Out) |
| Bengals | Kyle Dugger (S, Out); Colbie Young (WR, Out) |
| Browns | Elgton Jenkins (C, Out); Tylan Wallace (WR, Out); Teven Jenkins (G, Out) |
| Cowboys | Cobie Durant (CB, Out); DeMarvion Overshown (LB, Out) |
| Broncos | Dondrea Tillman (LB, Out) |
| Lions | Ben Bartch (G, Out) |
| Packers | Aaron Banks (G, Out); Jacob Monk (C, Out); Warren Brinson (DT, Out); Anthony Campbell (DT, Out) |
| Texans | M.J. Stewart (S, Out); Azeez Al-Shaair (LB, Out) |
| Colts | none listed Out/Doubtful |
| Jaguars | none listed Out/Doubtful |
| Chiefs | Josh Simmons (T, Out) |
| Rams | Aaron Donald (DT, Out); Jaylen Watson (CB, Out); Terrance Ferguson (TE, Out) |
| Chargers | Dalvin Tomlinson (DT, Out); Kayode Awosika (G, Out); Charlie Kolar (TE, Out); Brenen Thompson (WR, Out) |
| Raiders | Jackson Powers-Johnson (G, Out) |
| Dolphins | Rob Beal Jr. (LB, Out); Storm Duck (CB, Out); Caleb Douglas (WR, Out) |
| Vikings | Justin Jefferson (WR, Out); Charles Demmings (CB, Out) |
| Patriots | Christian Barmore (DT, Out); Brenden Schooler (S, Out); Christian Gonzalez (CB, Out) |
| Saints | Kaden Elliss (LB, Out); Carl Granderson (LB, Out); Anfernee Jennings (LB, Out) |
| Giants | none listed Out/Doubtful |
| Jets | Dylan Parham (G, Out); Breece Hall (RB, Out); Adonai Mitchell (WR, Out); Francisco Mauigoa (LB, Out); Mason Taylor (TE, Out) |
| Eagles | Dallas Goedert (TE, Out); Fred Johnson (T, Out); Marcus Epps (S, Out); Marquise Brown (WR, Out); Zack Baun (LB, Out); DeVonta Smith (WR, Out) |
| Steelers | Rico Dowdle (RB, Out); Joey Porter Jr. (CB, Out) |
| Seahawks | Zach Charbonnet (RB, Out); Jadarian Price (RB, Out) |
| 49ers | Nick Bosa (DE, Out); Mykel Williams (DE, Out); James Thompson Jr. (DT, Out) |
| Buccaneers | Baker Mayfield (QB, Out); Ko Kieft (TE, Out); Benjamin Morrison (CB, Out); Rueben Bain Jr. (LB, Out) |
| Titans | none listed Out/Doubtful |
| Commanders | Sam Cosmi (G, Out); Rachaad White (RB, Out); Nick Cross (S, Out); Jayden Daniels (QB, Out) |