Week 7 Technical Report: A 181-Yard Gap for the Houston Texans, 62 Garbage Snaps for the Carolina Panthers, and the San Francisco 49ers Still on Top
All fourteen Week 7 games, Thursday through Monday night: the scoreboard versus the play-by-play, quarterbacks with charted drops and sacks, coaching flags, injuries and the full 32-team ratings.
Every table sorts: click a column header, click again to reverse it, and once more to go back to the original order.
Technical report. NFL Week 7, Thursday October 22 through Monday night October 26, 2026 (all 14 games). 2026 regular season only, garbage time removed.
Scope
All fourteen NFL games of Week 7, 2026 regular season, from Thursday night's New England Patriots at Chicago Bears through Monday night's Dallas Cowboys at Philadelphia Eagles, including Pittsburgh Steelers versus New Orleans Saints in Paris. San Francisco 49ers, Houston Texans, the New York Giants and New Orleans Saints are on bye in Week 8. All data is 2026 regular season only.
How to read this
EPA (expected points added) scores every snap by how much it changed a team's chance to score. Garbage time, the snaps after a game is effectively decided, is removed from every per-play number (EPA, success rate, CPOE). CPOE is completion percentage over expected. Yards, plays, third downs, giveaways (interceptions plus lost fumbles) and sacks are full-game counts on pass and run plays; yards per play counts sacks as lost yards. The tape margin turns each team's total EPA over the whole game into the point margin it normally produces, based on this season's completed games. Because the tape counts offensive snaps only, defensive and special teams touchdowns show up as a gap between the scoreboard and the tape. The flattered column is the scoreboard margin minus the tape margin: positive means the scoreboard was kinder to that team than the plays were. Red zone trips are drives that ran at least one play inside the opponent's 20. Power ratings combine two opponent-adjusted measures, net EPA per play and net success rate (offense minus defense, garbage time removed). Every 2026 game counts, and a blowout that was mostly garbage time counts for less than a full competitive game. In a backtest that predicted each game from earlier games only (Weeks 3 to 7, 75 games), this rating had a correlation of 0.19 with the real margin and picked 63 percent of winners, against 0.14 and 56 percent for EPA alone; weighting recent games more heavily did not help. The sample is small, so treat that as a lean.
Data availability
Play-by-play and schedules are loaded for all 14 Week 7 games, and every game, including Monday night's, has its final play and a final score that matches the schedule. Official injury reports (Week 7) loaded. Player-tracking passing data holds 27 quarterbacks for Week 7, Monday night's included. Charting covers 13 of 14 games; it has not been published for Monday night's Dallas Cowboys at Philadelphia Eagles game yet, so drops, quarterback-fault sacks, contested balls and blitz counts are shown as n/a for that game and every charting-based pass-rush or drop number excludes it. A second weekly passing file holds only Thursday's New England Patriots at Chicago Bears game, so it is a two-quarterback cross-check only. No official Week 8 injury report has posted yet, and a news search returned nothing verified, so injuries below are the official Week 7 report.
1. Game by game
NE at CHI (Thursday, both teams on 4 days of rest): Chicago Bears won 30-24. New England Patriots gained 380 yards on 49 plays (7.76 a play) and Chicago Bears 406 on 65 (6.25). Drake Maye went 24 of 32 for 321 yards at plus 13.9 CPOE and Caleb Williams 22 of 36 for 308; Williams had 3 receiver drops (charted). The tape has Chicago Bears by 2.8. A second source had Williams pressured on 15.4 percent of dropbacks and Maye on 16.7.
PIT at NO (Paris, neutral site): Pittsburgh Steelers won 16-10 and went 10 for 16 on third down to New Orleans Saints' 6 for 12. EPA per play was plus 0.159 to plus 0.061. Aaron Rodgers took 3 sacks and all 3 are charted as the quarterback's fault; Tyler Shough took 2, both his fault. J. Warren ran 18 times for 101 yards at plus 6.17 EPA. The tape has Pittsburgh Steelers by 3.1.
SF at ATL: Atlanta Falcons won 29-20 despite 400 yards to 298. San Francisco 49ers gave the ball away 4 times (2 interceptions, 2 lost fumbles) to Atlanta Falcons' 0. EPA per play was nearly level, plus 0.001 for San Francisco 49ers and plus 0.090 for Atlanta Falcons. Michael Penix went 25 of 33 for 213 yards and 3 touchdowns; Brock Purdy threw 2 interceptions. The tape has Atlanta Falcons by 1.7 against a 9-point win.
CIN at BAL: Cincinnati Bengals won 35-13 and scored a touchdown on all 5 red zone trips to Baltimore Ravens' 0 for 3. Joe Burrow was 22 of 31 for 292 yards and 4 touchdowns at plus 17.7 CPOE, and T. Higgins caught 6 for 148. Tyler Huntley threw for 298 yards and took 4 sacks, none charted as his fault. The tape has Cincinnati Bengals by 17.4.
TB at CAR: Tampa Bay Buccaneers won 43-13, but 62 of the game's 112 pass and run snaps were garbage time, and one touchdown was Tampa Bay Buccaneers' C. Kancey returning a fumble 32 yards, a score the tape does not count. Carolina Panthers took 5 sacks, gave the ball away 3 times and Bryce Young was minus 0.696 EPA a dropback on 13 competitive dropbacks. Tampa Bay Buccaneers ran 47 times to 11 dropbacks for Baker Mayfield; B. Irving had 24 carries for 106 yards and 2 touchdowns. The tape has Tampa Bay Buccaneers by 20.3.
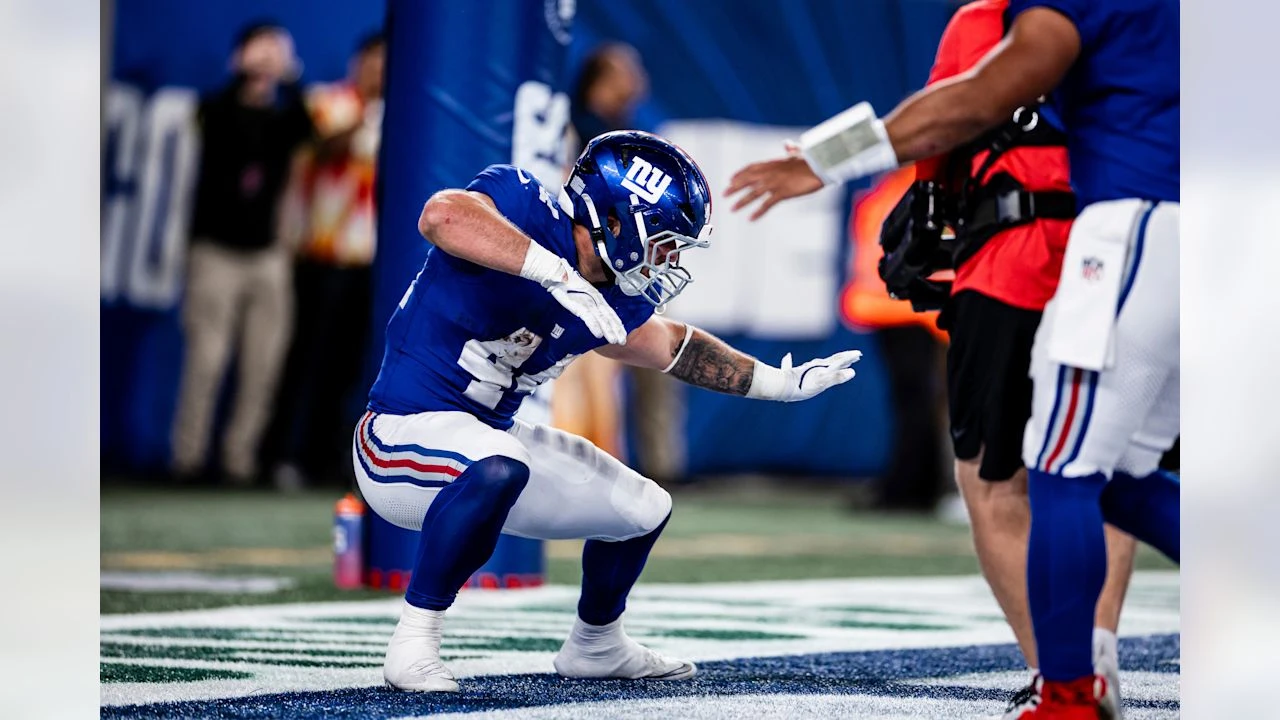
NYG at HOU (overtime): New York Giants won 27-21. The Giants outgained Houston Texans 420 to 239, 6.56 yards a play to 4.35, and Houston Texans went 3 for 12 on third down. Neither team gave the ball away. J.J. McCarthy was 20 of 30 for 252 yards with no touchdowns and all 3 sacks charted as his fault; Skattebo ran 17 times for 124 yards. C.J. Stroud was minus 9.1 CPOE. The tape has New York Giants by 14.4, so Houston Texans' 6-point loss was kind to Houston Texans by 8.4, the largest gap of the week in a game with no defensive score.
IND at MIN: Minnesota Vikings won 16-10 and moved to 6-0 in a game both offenses lost on EPA (minus 0.112 for Indianapolis Colts, minus 0.081 for Minnesota Vikings). Indianapolis Colts gained 218 yards at 3.69 a play and took 4 sacks, none charted as Daniel Jones' fault. Minnesota Vikings blitzed 77.8 percent of Indianapolis Colts' dropbacks and went 3 for 11 on third down. The tape has Minnesota Vikings by 1.7.
MIA at NYJ: Miami Dolphins won 28-25 in a shootout where both offenses ran well above average, plus 0.283 EPA per play for Miami Dolphins and plus 0.220 for the Jets. Malik Willis was 14 of 23 for 208 yards and 2 touchdowns; Geno Smith threw for 287 yards and 3 touchdowns with 1 interception. Scoreboard and tape agree (tape Miami Dolphins by 2.4).
CLE at TEN: Cleveland Browns won 27-24 with 491 yards at 7.44 a play to Tennessee Titans' 322 at 5.19. Each team gave it away twice. Deshaun Watson threw for 308 yards at plus 6.9 CPOE with 3 receiver drops, and Q. Judkins ran for 96 yards and 2 touchdowns. The tape has Cleveland Browns by 10.1 against a 3-point win.
DEN at ARI: Denver Broncos won 30-16 and 38 snaps were garbage time. Denver Broncos ran at plus 0.294 EPA a play, Arizona Cardinals at minus 0.153 and went 1 for 5 in the red zone. Jacoby Brissett threw 51 passes for 272 yards at minus 0.221 EPA a dropback with 3 receiver drops. Scoreboard and tape agree (tape Denver Broncos by 14.7).
GB at DET: Detroit Lions won 20-17. Detroit Lions outgained Green Bay Packers 416 to 324 but lost 2 fumbles and went 2 for 6 in the red zone; Green Bay Packers went 1 for 4 and threw an interception. EPA per play was plus 0.037 for Green Bay Packers and minus 0.063 for Detroit Lions, and the tape has Green Bay Packers by 4.9. Jared Goff threw for 303 yards, Amon-Ra St. Brown had 9 catches for 153 yards, and J. Gibbs carried 29 times for 116 yards at minus 6.64 EPA.
LAR at LV: the Rams won 35-21 and 63 snaps were garbage time. The Rams ran at plus 0.494 EPA a play with all 5 red zone trips ending in touchdowns; Las Vegas Raiders ran at minus 0.383 and went 3 for 14 on third down. Matthew Stafford was 23 of 30 for 195 yards and 3 touchdowns. Kirk Cousins threw 48 passes for 295 yards, but only 17 of his dropbacks were competitive. The tape has the Rams by 16.7.
KC at SEA: Seattle Seahawks won 20-3. Kansas City Chiefs gained 213 yards at 4.26 a play, had no red zone trips and Patrick Mahomes threw for 165 yards, no touchdowns and an interception at minus 6.3 CPOE. Seattle Seahawks gained 410 yards, went 11 for 16 on third down and took no sacks, but went 0 for 3 on red zone touchdowns. Jaxon Smith-Njigba had 9 catches for 150 yards and a touchdown at plus 12.44 EPA. The tape has Seattle Seahawks by 12.1 against a 17-point win.
DAL at PHI (Monday night): Dallas Cowboys won 38-21 with a plus 0.348 EPA per play and 8 of 13 on third down, and was not sacked. Dak Prescott was 15 of 27 for 212 yards and 3 touchdowns, and J. Williams ran 25 times for 155 yards, the most rushing EPA of the week at plus 7.68. The tape has Dallas Cowboys by 16.5 against a 17-point win. Charting has not been published for this game.
Game by game: the box scores
 NE at  CHI | Thu | CHI 30, NE 24 | CHI home | 4/4 | 380/406 | 49/65 | 7.76/6.25 | 2/7; 4/12 | 1/0 | 2/3 | +0.171/+0.240 | +13.9/+6.7 | 1/2; 3/4 | 8 | CHI +2.8 | +3.2 CHI |
 PIT at  NO | Sun | PIT 16, NO 10 | Paris (neutral) | 7/7 | 345/281 | 61/57 | 5.66/4.93 | 10/16; 6/12 | 0/1 | 3/2 | +0.159/+0.061 | -2.9/+3.3 | 1/4; 1/3 | 3 | PIT +3.1 | +2.9 PIT |
 SF at  ATL | Sun | ATL 29, SF 20 | ATL home | 6/7 | 400/298 | 64/59 | 6.25/5.05 | 4/10; 4/11 | 4/0 | 2/0 | +0.001/+0.090 | +2.3/+5.5 | 2/2; 2/5 | 10 | ATL +1.7 | +7.3 ATL |
 CIN at  BAL | Sun | CIN 35, BAL 13 | BAL home | 14/7 | 357/359 | 51/65 | 7.00/5.52 | 6/11; 9/16 | 0/1 | 1/4 | +0.390/+0.074 | +17.7/-0.8 | 5/5; 0/3 | 16 | CIN +17.4 | +4.6 CIN |
 TB at  CAR | Sun | TB 43, CAR 13 | CAR home | 7/7 | 325/266 | 58/54 | 5.60/4.93 | 7/12; 6/11 | 0/3 | 0/5 | +0.229/-0.432 | -14.0/-10.4 | 3/4; 1/2 | 62 | TB +20.3 | +9.7 TB |
 NYG at  HOU | Sun | NYG 27, HOU 21 (OT) | HOU home | 7/7 | 420/239 | 64/55 | 6.56/4.35 | 5/12; 3/12 | 0/0 | 3/1 | +0.244/-0.062 | +8.0/-9.1 | 3/3; 2/2 | 0 | NYG +14.4 | +8.4 HOU |
 IND at  MIN | Sun | MIN 16, IND 10 | MIN home | 7/14 | 218/277 | 59/54 | 3.69/5.13 | 8/15; 3/11 | 1/0 | 4/3 | -0.112/-0.081 | -10.1/-7.5 | 0/1; 1/2 | 0 | MIN +1.7 | +4.3 MIN |
 MIA at  NYJ | Sun | MIA 28, NYJ 25 | NYJ home | 14/7 | 362/380 | 62/53 | 5.84/7.17 | 5/12; 7/13 | 0/1 | 2/2 | +0.283/+0.220 | -4.5/+12.7 | 3/3; 3/4 | 3 | MIA +2.4 | +0.6 MIA |
 CLE at  TEN | Sun | CLE 27, TEN 24 | TEN home | 7/7 | 491/322 | 66/62 | 7.44/5.19 | 5/11; 5/13 | 2/2 | 1/1 | +0.147/-0.060 | +6.9/+1.6 | 3/4; 2/4 | 0 | CLE +10.1 | +7.1 TEN |
 DEN at  ARI | Sun | DEN 30, ARI 16 | ARI home | 10/7 | 379/353 | 54/75 | 7.02/4.71 | 3/11; 5/17 | 0/0 | 1/3 | +0.294/-0.153 | +0.7/-2.9 | 1/2; 1/5 | 38 | DEN +14.7 | +0.7 ARI |
 GB at  DET | Sun | DET 20, GB 17 | DET home | 7/14 | 324/416 | 65/65 | 4.98/6.40 | 5/15; 5/10 | 1/2 | 1/1 | +0.037/-0.063 | -0.5/-1.0 | 1/4; 2/6 | 0 | GB +4.9 | +7.9 DET |
 LAR at  LV | Sun | LAR 35, LV 21 | LV home | 7/7 | 389/350 | 65/66 | 5.98/5.30 | 5/9; 3/14 | 2/0 | 1/2 | +0.494/-0.383 | +16.8/-13.4 | 5/5; 2/6 | 63 | LAR +16.7 | +2.7 LV |
 KC at  SEA | Sun | SEA 20, KC 3 | SEA home | 7/10 | 213/410 | 50/69 | 4.26/5.94 | 3/11; 11/16 | 1/1 | 1/0 | -0.028/+0.150 | -6.3/+3.6 | 0/0; 0/3 | 18 | SEA +12.1 | +4.9 SEA |
 DAL at  PHI | Mon | DAL 38, PHI 21 | PHI home | 8/8 | 418/321 | 66/62 | 6.33/5.18 | 8/13; 5/12 | 0/1 | 0/2 | +0.348/+0.060 | +0.6/-0.5 | 3/5; 3/3 | 19 | DAL +16.5 | +0.5 DAL |
2. Scoreboard versus tape
Scoreboard flattered most this week: Tampa Bay Buccaneers (plus 9.7, helped by a defensive touchdown), Houston Texans (plus 8.4, in an overtime loss), Detroit Lions (plus 7.9), Atlanta Falcons (plus 7.3), Tennessee Titans (plus 7.1, in a loss), Seattle Seahawks (plus 4.9), Cincinnati Bengals (plus 4.6) and Minnesota Vikings (plus 4.3). Most shortchanged: Carolina Panthers (minus 9.7), the New York Giants (minus 8.4), Green Bay Packers (minus 7.9), San Francisco 49ers (minus 7.3), Cleveland Browns (minus 7.1) and Kansas City Chiefs (minus 4.9). Season long (seven games, scoreboard margin minus tape margin, summed): Philadelphia Eagles (plus 28.0), Minnesota Vikings (plus 27.1), Detroit Lions (plus 19.6), Chicago Bears (plus 18.7) and Pittsburgh Steelers (plus 16.7) have the most flattering results; the Rams (minus 28.6), Arizona Cardinals (minus 24.6), Baltimore Ravens (minus 20.8), Green Bay Packers (minus 19.8) and Carolina Panthers (minus 18.6) have the least.
- TB
- HOU
- DET
- ATL
- TEN
- SEA
- CIN
- MIN
- CHI
- PIT
- LV
- ARI
- MIA
- DAL
- PHI
- NYJ
- DEN
- LAR
- NO
- NE
- IND
- BAL
- KC
- CLE
- SF
- GB
- NYG
- CAR
Scoreboard margin minus play-by-play margin (points); positive means flattered
Scoreboard versus tape
| TB | CAR | +30 | +20.3 | +9.7 | Flattered |
| HOU | NYG | -6 | -14.4 | +8.4 | Flattered |
| DET | GB | +3 | -4.9 | +7.9 | Flattered |
| ATL | SF | +9 | +1.7 | +7.3 | Flattered |
| TEN | CLE | -3 | -10.1 | +7.1 | Flattered |
| SEA | KC | +17 | +12.1 | +4.9 | Flattered |
| CIN | BAL | +22 | +17.4 | +4.6 | Flattered |
| MIN | IND | +6 | +1.7 | +4.3 | Flattered |
| CHI | NE | +6 | +2.8 | +3.2 | Flattered |
| PIT | NO | +6 | +3.1 | +2.9 | About right |
| LV | LAR | -14 | -16.7 | +2.7 | About right |
| ARI | DEN | -14 | -14.7 | +0.7 | About right |
| MIA | NYJ | +3 | +2.4 | +0.6 | About right |
| DAL | PHI | +17 | +16.5 | +0.5 | About right |
| PHI | DAL | -17 | -16.5 | -0.5 | About right |
| NYJ | MIA | -3 | -2.4 | -0.6 | About right |
| DEN | ARI | +14 | +14.7 | -0.7 | About right |
| LAR | LV | +14 | +16.7 | -2.7 | About right |
| NO | PIT | -6 | -3.1 | -2.9 | About right |
| NE | CHI | -6 | -2.8 | -3.2 | Shortchanged |
| IND | MIN | -6 | -1.7 | -4.3 | Shortchanged |
| BAL | CIN | -22 | -17.4 | -4.6 | Shortchanged |
| KC | SEA | -17 | -12.1 | -4.9 | Shortchanged |
| CLE | TEN | +3 | +10.1 | -7.1 | Shortchanged |
| SF | ATL | -9 | -1.7 | -7.3 | Shortchanged |
| GB | DET | -3 | +4.9 | -7.9 | Shortchanged |
| NYG | HOU | +6 | +14.4 | -8.4 | Shortchanged |
| CAR | TB | -30 | -20.3 | -9.7 | Shortchanged |
3. Quarterbacks (with charting)
Quarterbacks with 10 or more dropbacks. Attempts exclude sacks. Completion percent if drops caught adds charted receiver drops to completions. Monday night's Dallas Cowboys and Philadelphia Eagles quarterbacks show n/a for the charted columns. Best of the week with at least 20 competitive dropbacks: Matthew Stafford (plus 0.609 EPA a dropback), Joe Burrow (plus 0.567), Malik Willis (plus 0.496), Dak Prescott (plus 0.446) and Caleb Williams (plus 0.435). Worst with at least 20: Daniel Jones (minus 0.299), Jacoby Brissett (minus 0.221), Patrick Mahomes (minus 0.070), Tanner McKee (minus 0.016) and Brock Purdy (minus 0.015). Bryce Young (minus 0.696) and Kirk Cousins (minus 0.483) graded worse but on only 13 and 17 competitive dropbacks, because their games were mostly garbage time.
Quarterbacks
| LAR | M.Stafford | 23/30 | 195 | 3 | 1 | 1 | 23 | +0.609 | +16.8 | 1 | 0 | 0 | 80% |
| CIN | J.Burrow | 22/31 | 292 | 4 | 0 | 1 | 28 | +0.567 | +17.7 | 0 | 0 | 0 | 71% |
| MIA | M.Willis | 14/23 | 208 | 2 | 0 | 2 | 23 | +0.496 | -4.5 | 0 | 0 | 0 | 61% |
| DAL | D.Prescott | 15/27 | 212 | 3 | 0 | 0 | 27 | +0.446 | +0.6 | n/a | n/a | n/a | n/a |
| CHI | C.Williams | 22/36 | 308 | 2 | 0 | 3 | 35 | +0.435 | +6.7 | 3 | 0 | 0 | 69% |
| SEA | S.Darnold | 20/28 | 257 | 1 | 1 | 0 | 27 | +0.417 | +3.6 | 0 | 0 | 1 | 71% |
| NE | D.Maye | 24/32 | 321 | 2 | 1 | 2 | 28 | +0.375 | +13.9 | 0 | 0 | 1 | 75% |
| BAL | T.Huntley | 23/38 | 298 | 1 | 1 | 4 | 34 | +0.302 | -0.8 | 1 | 0 | 1 | 63% |
| NYJ | G.Smith | 23/33 | 287 | 3 | 1 | 2 | 30 | +0.294 | +12.7 | 1 | 0 | 2 | 73% |
| ATL | M.Penix | 25/33 | 213 | 3 | 0 | 0 | 33 | +0.279 | +5.5 | 2 | 0 | 0 | 82% |
| DET | J.Goff | 22/33 | 303 | 2 | 0 | 1 | 33 | +0.279 | -1.0 | 0 | 0 | 1 | 67% |
| NO | T.Shough | 30/40 | 278 | 1 | 1 | 2 | 40 | +0.264 | +3.3 | 0 | 2 | 2 | 75% |
| NYG | J.McCarthy | 20/30 | 252 | 0 | 0 | 3 | 30 | +0.179 | +8.0 | 0 | 3 | 0 | 67% |
| DEN | B.Nix | 15/30 | 222 | 1 | 0 | 1 | 23 | +0.174 | +0.7 | 0 | 0 | 1 | 50% |
| GB | J.Love | 27/46 | 274 | 2 | 1 | 1 | 46 | +0.151 | -0.5 | 1 | 0 | 3 | 61% |
| TB | B.Mayfield | 7/11 | 64 | 1 | 0 | 0 | 6 | +0.142 | -14.0 | 1 | 0 | 0 | 73% |
| PIT | A.Rodgers | 19/33 | 212 | 1 | 0 | 3 | 33 | +0.063 | -2.9 | 0 | 3 | 0 | 58% |
| CLE | D.Watson | 25/37 | 308 | 0 | 1 | 1 | 37 | +0.061 | +6.9 | 3 | 0 | 1 | 76% |
| TEN | C.Ward | 20/32 | 181 | 0 | 1 | 1 | 32 | +0.013 | +1.6 | 2 | 1 | 1 | 69% |
| MIN | K.Murray | 14/27 | 150 | 1 | 0 | 3 | 27 | -0.003 | -7.5 | 3 | 1 | 2 | 63% |
| HOU | C.Stroud | 17/30 | 153 | 2 | 0 | 1 | 30 | -0.013 | -9.1 | 1 | 1 | 1 | 60% |
| SF | B.Purdy | 27/41 | 288 | 1 | 2 | 2 | 35 | -0.015 | +2.3 | 1 | 0 | 2 | 68% |
| PHI | T.McKee | 23/37 | 211 | 1 | 1 | 2 | 30 | -0.016 | -0.5 | n/a | n/a | n/a | n/a |
| KC | P.Mahomes | 19/34 | 165 | 0 | 1 | 1 | 30 | -0.070 | -6.3 | 2 | 1 | 1 | 62% |
| ARI | J.Brissett | 27/51 | 272 | 1 | 0 | 3 | 34 | -0.221 | -2.9 | 3 | 0 | 2 | 59% |
| IND | D.Jones | 13/26 | 108 | 0 | 1 | 4 | 26 | -0.299 | -10.1 | 1 | 0 | 2 | 54% |
| LV | K.Cousins | 26/48 | 295 | 2 | 0 | 2 | 17 | -0.483 | -13.4 | 1 | 1 | 1 | 56% |
| CAR | B.Young | 14/32 | 163 | 1 | 2 | 5 | 13 | -0.696 | -10.4 | 1 | 0 | 2 | 47% |
4. Player-tracking cross-check
Time to throw, intended air yards and aggressiveness from player-tracking data, next to play-by-play CPOE. They disagree in places and both are shown. The widest gaps: Kirk Cousins (tracking plus 3.4, play-by-play minus 13.4), Daniel Jones (plus 2.5 against minus 10.1), Jared Goff (plus 6.0 against minus 1.0), Patrick Mahomes (minus 13.2 against minus 6.3) and Joe Burrow (plus 8.4 against plus 17.7).
Player-tracking cross-check
| Jacoby Brissett | ARI | 2.82 | 8.6 | 29.2 | +3.1 | -2.9 |
| Michael Penix Jr. | ATL | 2.50 | 5.7 | 2.9 | +0.5 | +5.5 |
| Tyler Huntley | BAL | 2.80 | 6.7 | 8.8 | -4.6 | -0.8 |
| Bryce Young | CAR | 2.60 | 6.8 | 11.1 | -10.9 | -10.4 |
| Caleb Williams | CHI | 3.12 | 7.3 | 0.0 | +2.8 | +6.7 |
| Joe Burrow | CIN | 3.06 | 8.8 | 10.0 | +8.4 | +17.7 |
| Deshaun Watson | CLE | 2.76 | 8.4 | 5.6 | +0.1 | +6.9 |
| Dak Prescott | DAL | 3.09 | 13.4 | 33.3 | +1.3 | +0.6 |
| Bo Nix | DEN | 3.05 | 10.7 | 24.1 | -4.8 | +0.7 |
| Jared Goff | DET | 2.84 | 8.2 | 25.0 | +6.0 | -1.0 |
| Jordan Love | GB | 2.77 | 10.4 | 26.7 | +0.2 | -0.5 |
| C.J. Stroud | HOU | 2.89 | 8.2 | 25.0 | -2.1 | -9.1 |
| Daniel Jones | IND | 2.65 | 5.9 | 13.6 | +2.5 | -10.1 |
| Patrick Mahomes | KC | 3.17 | 4.6 | 3.0 | -13.2 | -6.3 |
| Matthew Stafford | LAR | 2.70 | 4.9 | 6.9 | +2.5 | +16.8 |
| Kirk Cousins | LV | 2.70 | 8.2 | 29.5 | +3.4 | -13.4 |
| Malik Willis | MIA | 2.91 | 5.1 | 14.3 | -3.2 | -4.5 |
| Kyler Murray | MIN | 2.70 | 8.8 | 12.5 | -12.2 | -7.5 |
| Drake Maye | NE | 3.17 | 8.9 | 6.5 | +9.3 | +13.9 |
| Tyler Shough | NO | 2.50 | 4.7 | 5.3 | -0.4 | +3.3 |
| J.J. McCarthy | NYG | 2.84 | 9.8 | 14.3 | +9.2 | +8.0 |
| Geno Smith | NYJ | 2.76 | 5.8 | 10.0 | +8.0 | +12.7 |
| Tanner McKee | PHI | 2.78 | 5.3 | 11.4 | -0.9 | -0.5 |
| Aaron Rodgers | PIT | 2.61 | 6.6 | 26.7 | +4.6 | -2.9 |
| Sam Darnold | SEA | 2.45 | 5.7 | 21.4 | +6.8 | +3.6 |
| Brock Purdy | SF | 2.99 | 7.6 | 20.0 | +0.4 | +2.3 |
| Cam Ward | TEN | 2.66 | 7.8 | 12.9 | +0.8 | +1.6 |
5. Charted data and pressure
Where charting exists, a quarterback's play can be split from receiver drops and protection. Aaron Rodgers (3 sacks), J.J. McCarthy (3) and Tyler Shough (2) had every sack they took charted as the quarterback's fault. Tyler Huntley (4 sacks), Daniel Jones (4) and Bryce Young (5) had none charted as theirs: those were protection or coverage problems. Receivers dropped 3 passes each from Caleb Williams, Deshaun Watson, Jacoby Brissett and Kyler Murray. Brissett also had 23 throws charted as contested balls on 51 dropbacks. Penix would have completed 82 percent and Stafford 80 percent with the drops caught.
Pressure: Minnesota Vikings (29.6 percent of competitive dropbacks ended in a sack or quarterback hit, on a 77.8 percent blitz rate), Denver Broncos (22.9) and Baltimore Ravens (20.7) created the most; San Francisco 49ers and Philadelphia Eagles produced no sacks and no hits, and Arizona Cardinals (4.0) and Los Angeles Rams (5.3, on 19 dropbacks) the next fewest. Carolina Panthers and Tampa Bay Buccaneers (asterisks) faced too few competitive dropbacks for their rates to mean much. San Francisco 49ers played without Nick Bosa. A second source for Thursday's game: Williams was pressured on 15.4 percent of dropbacks and Maye on 16.7, in line with the play-by-play rates; it credits Williams with 2 drops where the charting has 3.
Pass rush by defense, Week 7
| MIN | 27 | 4 | 4 | 29.6 | 77.8 |
| DEN | 35 | 2 | 6 | 22.9 | 40.0 |
| BAL | 29 | 1 | 5 | 20.7 | 27.6 |
| HOU | 30 | 3 | 3 | 20.0 | 46.7 |
| SEA | 32 | 1 | 5 | 18.8 | 25.0 |
| TEN | 38 | 1 | 6 | 18.4 | 23.7 |
| IND | 29 | 3 | 2 | 17.2 | 27.6 |
| CAR* | 6 | 0 | 1 | 16.7 | 50.0 |
| MIA | 31 | 2 | 3 | 16.1 | 22.6 |
| TB* | 13 | 2 | 0 | 15.4 | 38.5 |
| CIN | 36 | 3 | 2 | 13.9 | 22.2 |
| NE | 37 | 2 | 3 | 13.5 | 59.5 |
| DET | 46 | 1 | 5 | 13.0 | 17.4 |
| LV | 23 | 1 | 2 | 13.0 | 34.8 |
| NYG | 31 | 1 | 3 | 12.9 | 41.9 |
| PIT | 41 | 2 | 3 | 12.2 | 29.3 |
| CLE | 33 | 1 | 3 | 12.1 | 21.2 |
| NO | 34 | 3 | 1 | 11.8 | 35.3 |
| CHI | 31 | 2 | 1 | 9.7 | 41.9 |
| ATL | 35 | 2 | 1 | 8.6 | 20.0 |
| NYJ | 28 | 2 | 0 | 7.1 | 46.4 |
| KC | 29 | 0 | 2 | 6.9 | 24.1 |
| DAL | 31 | 2 | 0 | 6.5 | n/a |
| GB | 33 | 1 | 1 | 6.1 | 30.3 |
| LAR | 19 | 0 | 1 | 5.3 | 31.6 |
| ARI | 25 | 1 | 0 | 4.0 | 40.0 |
| PHI | 28 | 0 | 0 | 0.0 | n/a |
| SF | 34 | 0 | 0 | 0.0 | 29.4 |
6. Players who looked better, and worse, than they were
Looked better than they were: J. Gibbs (29 carries, 116 yards, minus 6.64 EPA, one lost fumble), Jacoby Brissett (27 of 51 for 272 yards, minus 0.221 a dropback, 3 drops and 2 interception-worthy throws), T. Tucker of Las Vegas Raiders (12 targets, 103 yards and a touchdown, but minus 2.08 EPA), Brock Purdy (27 of 41 for 288 yards, 2 interceptions, minus 0.015 a dropback) and Kirk Cousins (295 yards and 2 touchdowns in a 14-point loss, minus 13.4 CPOE on 17 competitive dropbacks).
Looked worse than they were: Drake Maye (321 yards, plus 0.375 a dropback and plus 13.9 CPOE in a loss, with player-tracking agreeing at plus 9.3), Tyler Huntley (298 yards, plus 0.302 a dropback, 4 sacks none his fault, in a 22-point loss), J.J. McCarthy (no touchdowns but plus 0.179 a dropback and plus 8.0 CPOE in an overtime win), Sam Darnold (20 of 28 for 257 yards, plus 0.417 a dropback, no sacks), Z. Flowers (8 catches, 137 yards, plus 11.83 EPA in a blowout loss), Skattebo (17 carries, 124 yards, plus 3.36) and Deshaun Watson (308 yards, no touchdowns, plus 6.9 CPOE, 3 drops).
7. Rushers (8 or more carries): best five and worst five by EPA
Rushers
| J.Williams | DAL | 25 | 155 | +7.68 | 1 | 0 |
| B.Irving | TB | 24 | 106 | +7.29 | 2 | 0 |
| J.Warren | PIT | 18 | 101 | +6.17 | 0 | 0 |
| Q.Judkins | CLE | 17 | 96 | +3.69 | 2 | 0 |
| B.Corum | LAR | 17 | 93 | +3.43 | 1 | 0 |
| Bi.Robinson | ATL | 20 | 63 | -5.08 | 0 | 0 |
| W.Marks | HOU | 19 | 66 | -5.24 | 0 | 0 |
| D.Henry | BAL | 17 | 45 | -5.96 | 0 | 0 |
| A.Jones | MIN | 8 | 26 | -6.34 | 0 | 0 |
| J.Gibbs | DET | 29 | 116 | -6.64 | 0 | 1 |
8. Receivers (7 or more targets): best six and worst six by EPA
Receivers
| J.Smith-Njigba | SEA | 12 | 9 | 150 | +12.44 | 1 | 0 |
| T.Higgins | CIN | 7 | 6 | 148 | +11.94 | 1 | 0 |
| Z.Flowers | BAL | 11 | 8 | 137 | +11.83 | 1 | 0 |
| A.St. Brown | DET | 11 | 9 | 153 | +8.85 | 0 | 0 |
| K.Concepcion | CLE | 10 | 8 | 129 | +7.79 | 0 | 1 |
| D.London | ATL | 10 | 7 | 66 | +6.97 | 1 | 1 |
| B.Allen | NYJ | 7 | 6 | 30 | -1.19 | 0 | 0 |
| C.Olave | NO | 10 | 6 | 56 | -1.68 | 0 | 0 |
| T.Tucker | LV | 12 | 5 | 103 | -2.08 | 1 | 1 |
| D.Goedert | PHI | 7 | 5 | 48 | -4.35 | 0 | n/a |
| D.Boston | CLE | 8 | 3 | 27 | -7.12 | 0 | 1 |
| M.Golden | GB | 12 | 6 | 39 | -8.01 | 0 | 0 |
9. Coaching flags (directional only)
Directional flags only, never a grade; samples are small and coordinator names are not in the public data, so flags are at team and head-coach level. Neutral situations are first or second down in a competitive game, outside the last two minutes of a half; the pass rate figure is points above or below the expected pass rate in those situations. Season long, the Chargers (Jim Harbaugh) pass 13.1 points less than expected, Tennessee Titans (Robert Saleh) 12.0 less, Tampa Bay Buccaneers (Todd Bowles) 10.1 less, Seattle Seahawks (Mike Macdonald) 8.1 less and the Giants (John Harbaugh) 8.0 less; Carolina Panthers (Dave Canales, plus 9.6), Cincinnati Bengals (Zac Taylor, plus 9.2) and the Rams (Sean McVay, plus 6.8) pass the most over expectation. Tampa Bay Buccaneers (minus 31.5) and Seattle Seahawks (minus 27.0) ran far more than expected this week, which can reflect leading comfortably. Fourth down: San Francisco 49ers went for it on 4 of 5 snaps and converted 3; Green Bay Packers went on 4 of 9 and converted 3; Arizona Cardinals went on 4 of 12 and converted 2; Las Vegas Raiders went on 5 of 11 and converted 2. Defense: Seattle Seahawks (minus 0.188 EPA per play), Minnesota Vikings (minus 0.175), Tampa Bay Buccaneers (minus 0.133), Denver Broncos (minus 0.092) and Atlanta Falcons (minus 0.092) have the best opponent-adjusted defenses; Dallas Cowboys (plus 0.176), Miami Dolphins (plus 0.142), Tennessee Titans (plus 0.115), Buffalo Bills (plus 0.099) and Las Vegas Raiders (plus 0.085) the worst. Defensive samples are 7 games or fewer.
Coaching flags (directional only)
| TEN | Robert Saleh | 6 | 2 | 1 | -12.0 | -20.6 |
| TB | Todd Bowles | 5 | 1 | 0 | -10.1 | -31.5 |
| SEA | Mike Macdonald | 5 | 1 | 1 | -8.1 | -27.0 |
| NYG | John Harbaugh | 8 | 2 | 2 | -8.0 | -10.9 |
| MIA | Jeff Hafley | 7 | 3 | 3 | -6.7 | -8.6 |
| ATL | Raheem Morris | 6 | 0 | 0 | -6.3 | +5.3 |
| BAL | Jesse Minter | 7 | 2 | 0 | -6.3 | +6.5 |
| MIN | Kevin O'Connell | 8 | 2 | 1 | -6.0 | -5.8 |
| PHI | Nick Sirianni | 6 | 3 | 2 | -4.0 | -10.7 |
| CHI | Ben Johnson | 8 | 2 | 2 | -3.6 | +3.4 |
| NYJ | Aaron Glenn | 6 | 2 | 2 | -3.0 | -7.7 |
| HOU | DeMeco Ryans | 9 | 1 | 1 | -1.6 | -12.9 |
| DET | Dan Campbell | 5 | 2 | 0 | -1.4 | -4.7 |
| LV | Klint Kubiak | 11 | 5 | 2 | -1.3 | -13.3 |
| IND | Shane Steichen | 7 | 1 | 1 | -0.8 | -16.6 |
| NO | Kellen Moore | 6 | 2 | 2 | -0.8 | +12.1 |
| ARI | Jonathan Gannon | 12 | 4 | 2 | -0.7 | +5.7 |
| DAL | Brian Schottenheimer | 5 | 1 | 1 | +0.4 | -12.4 |
| NE | Mike Vrabel | 5 | 1 | 0 | +0.7 | +5.8 |
| DEN | Sean Payton | 7 | 0 | 0 | +0.9 | +4.7 |
| GB | Matt LaFleur | 9 | 4 | 3 | +0.9 | +7.1 |
| KC | Andy Reid | 8 | 3 | 2 | +2.7 | +4.4 |
| CLE | Todd Monken | 4 | 0 | 0 | +2.9 | -7.3 |
| SF | Kyle Shanahan | 5 | 4 | 3 | +3.4 | -5.5 |
| PIT | Mike McCarthy | 5 | 0 | 0 | +4.6 | +3.3 |
| LAR | Sean McVay | 3 | 0 | 0 | +6.8 | +14.0 |
| CIN | Zac Taylor | 4 | 0 | 0 | +9.2 | +12.6 |
| CAR | Dave Canales | 4 | 2 | 0 | +9.6 | +18.3 |
10. Injuries: official Week 7 report, players ruled Out
Injuries
| ARI | Andrew Wingard (S); Jon Gaines II (G); Walter Nolen (DT); Jeremiyah Love (RB) |
| ATL | Divine Deablo (LB); Brian Robinson (RB); Michael Jerrell (T); Billy Bowman Jr. (CB); Beaux Collins (WR); Cameron Williams (T) |
| BAL | Lamar Jackson (QB); Jaylinn Hawkins (S); Tavius Robinson (LB) |
| CAR | Jaelan Phillips (LB); Thomas Incoom (LB) |
| CHI | Jack Sanborn (LB); Kyle Monangai (RB) |
| CLE | Teven Jenkins (G); Kalia Davis (DT); Mike Hall Jr. (DT); Dillon Gabriel (QB) |
| DAL | KaVontae Turpin (WR); Dee Winters (LB); Drew Shelton (T) |
| DEN | Talanoa Hufanga (S); Tyler Badie (RB); Jonah Elliss (LB) |
| GB | Zaire Franklin (LB) |
| HOU | David Montgomery (RB); Reed Blankenship (S); Jalen Pitre (S); Blake Fisher (T) |
| IND | Sauce Gardner (CB); Anthony Gould (WR); Tyler Warren (TE); CJ Allen (LB) |
| KC | Jaylon Moore (T); Rashee Rice (WR); Brashard Smith (RB) |
| LAR | Nate Landman (LB) |
| LV | Carter Runyon (TE); Dont'e Thornton Jr. (WR) |
| MIA | Reese Taylor (CB) |
| NE | Carlton Davis III (CB); Alijah Vera-Tucker (G); Ben Brown (C); Karon Prunty (CB); Channing Canada (CB) |
| NYG | Tremaine Edmunds (LB); Greg Newsome II (CB); Jevon Holland (S) |
| NYJ | Joseph Ossai (DE); Max Mitchell (T); Francisco Mauigoa (LB) |
| PHI | Michael Carter II (CB); DeVonta Smith (WR); Dontayvion Wicks (WR); Nolan Smith (LB) |
| PIT | Brandin Echols (CB); Ben Skowronek (WR) |
| SEA | Chazz Surratt (LB); Drake Thomas (LB); Zach Charbonnet (RB) |
| SF | Mike Evans (WR); Luke Gifford (LB); Nick Bosa (DE); Deebo Samuel Sr. (WR); Garret Wallow (LB); Marques Sigle (S) |
| TB | Antoine Winfield Jr. (S); Luke Goedeke (T); Emeka Egbuka (WR) |
11. Power rankings after Week 7 (32 teams)
Ranked on the rating described above: opponent-adjusted net EPA per play and net success rate, garbage time removed, 2026 only. Offense EPA is points added per play on offense; Defense EPA is points allowed per play, so a negative number is a good defense. San Francisco 49ers, Jacksonville Jaguars and Cincinnati Bengals are the top three, with Seattle Seahawks fourth on the league's best defense by EPA (minus 0.188) and Chicago Bears fifth. Tampa Bay Buccaneers are 12th, up nine places from 21st after Week 6: the 43-13 win had only 50 competitive snaps, so it moves the rating less than a full game would. The Los Angeles Rams rise three places to 6th and the Denver Broncos two to 9th. The largest drops are the New York Jets (down six, to 21st), Carolina Panthers and Las Vegas Raiders (down five each). Prior rank is each team's rank after Week 6 under this same method, so it can differ from the order published in last week's report.
- SF
 JAX
- CIN
- SEA
- CHI
- LAR
- NE
- KC
- DEN
- BAL
- DAL
- IND
- NYG
- NO
 WSH
- LV
- PHI
- MIA
 LAC
- TEN
Rating: opponent-adjusted net EPA per play and net success rate (garbage time removed)
Power rankings after Week 7 (32 teams)
| 1 | SF | 49ers | 6-1 | +0.237 | +0.229 | +10.8 | +0.211 | -0.018 | 54.8 | 1 | 0 | BYE | - | -0.028 |
| 2 | JAX | Jaguars | 4-2 | +0.188 | +0.210 | +7.4 | +0.144 | -0.066 | 47.2 | 2 | 0 | vs IND | 14 | -0.067 |
| 3 | CIN | Bengals | 4-2 | +0.185 | +0.187 | +8.1 | +0.142 | -0.045 | 50.9 | 4 | +1 | vs TEN | 7 | -0.040 |
| 4 | SEA | Seahawks | 4-3 | +0.158 | +0.134 | +8.0 | -0.054 | -0.188 | 42.0 | 6 | +2 | vs CHI | 8 | +0.017 |
| 5 | CHI | Bears | 5-2 | +0.155 | +0.162 | +6.5 | +0.102 | -0.061 | 47.7 | 3 | -2 | at SEA | 11 | +0.010 |
| 6 | LAR | Rams | 3-4 | +0.127 | +0.123 | +5.7 | +0.057 | -0.066 | 49.1 | 9 | +3 | vs LAC | 7 | +0.023 |
| 7 | NE | Patriots | 4-3 | +0.116 | +0.111 | +5.3 | +0.081 | -0.030 | 46.4 | 5 | -2 | at MIA | 10 | -0.039 |
| 8 | KC | Chiefs | 5-1 | +0.107 | +0.101 | +4.9 | +0.122 | +0.021 | 48.5 | 7 | -1 | at DEN | 7 | +0.040 |
| 9 | DEN | Broncos | 5-2 | +0.084 | +0.101 | +2.9 | +0.009 | -0.092 | 38.2 | 11 | +2 | vs KC | 7 | -0.046 |
| 10 | BAL | Ravens | 4-3 | +0.061 | +0.067 | +2.5 | +0.084 | +0.017 | 47.1 | 8 | -2 | at  BUF | 7 | +0.022 |
| 11 | BUF | Bills | 5-1 | +0.049 | +0.076 | +1.0 | +0.175 | +0.099 | 48.5 | 10 | -1 | vs BAL | 14 | +0.007 |
| 12 | TB | Buccaneers | 2-5 | +0.020 | +0.047 | -0.3 | -0.086 | -0.133 | 39.7 | 21 | +9 | vs ATL | 7 | -0.008 |
| 13 | ATL | Falcons | 3-4 | +0.019 | +0.014 | +1.1 | -0.079 | -0.092 | 44.0 | 17 | +4 | at TB | 7 | +0.008 |
| 14 | DET | Lions | 4-2 | +0.018 | -0.024 | +2.7 | +0.043 | +0.067 | 49.3 | 16 | +2 | vs MIN | 7 | -0.007 |
| 15 | MIN | Vikings | 6-0 | +0.016 | +0.058 | -1.2 | -0.117 | -0.175 | 36.4 | 13 | -2 | at DET | 7 | +0.039 |
| 16 | HOU | Texans | 2-5 | +0.013 | -0.025 | +2.2 | -0.017 | +0.008 | 43.6 | 14 | -2 | BYE | - | -0.065 |
| 17 | CAR | Panthers | 3-3 | +0.004 | +0.013 | -0.2 | +0.087 | +0.074 | 43.7 | 12 | -5 | at GB | 4 | +0.021 |
| 18 | ARI | Cardinals | 2-5 | -0.003 | -0.082 | +3.4 | -0.019 | +0.064 | 44.0 | 18 | 0 | at DAL | 7 | -0.004 |
| 19 | PIT | Steelers | 5-2 | -0.009 | -0.004 | -0.6 | -0.009 | -0.005 | 41.6 | 22 | +3 | vs CLE | 7 | +0.018 |
| 20 | CLE | Browns | 5-2 | -0.009 | -0.019 | +0.0 | -0.076 | -0.057 | 41.7 | 20 | 0 | at PIT | 7 | +0.000 |
| 21 | NYJ | Jets | 2-5 | -0.010 | -0.007 | -0.5 | -0.034 | -0.026 | 45.5 | 15 | -6 | vs LV | 7 | -0.015 |
| 22 | GB | Packers | 4-3 | -0.031 | +0.054 | -5.1 | -0.004 | -0.058 | 39.4 | 19 | -3 | vs CAR | 4 | +0.016 |
| 23 | DAL | Cowboys | 3-4 | -0.065 | -0.092 | -1.7 | +0.084 | +0.176 | 48.3 | 25 | +2 | vs ARI | 6 | -0.002 |
| 24 | IND | Colts | 2-5 | -0.083 | -0.147 | -0.9 | -0.078 | +0.068 | 42.3 | 24 | 0 | at JAX | 7 | -0.021 |
| 25 | NYG | Giants | 4-2-1 | -0.093 | -0.091 | -4.2 | -0.062 | +0.029 | 41.4 | 28 | +3 | BYE | - | -0.003 |
| 26 | NO | Saints | 2-5 | -0.135 | -0.120 | -6.7 | -0.043 | +0.077 | 43.0 | 26 | 0 | BYE | - | +0.036 |
| 27 | WSH | Commanders | 1-4-1 | -0.142 | -0.114 | -7.5 | -0.055 | +0.058 | 39.1 | 29 | +2 | vs PHI | 13 | -0.002 |
| 28 | LV | Raiders | 3-4 | -0.147 | -0.118 | -7.8 | -0.033 | +0.085 | 42.9 | 23 | -5 | at NYJ | 7 | +0.019 |
| 29 | PHI | Eagles | 2-5 | -0.168 | -0.167 | -7.4 | -0.124 | +0.043 | 37.7 | 27 | -2 | at WSH | 6 | -0.008 |
| 30 | MIA | Dolphins | 1-5 | -0.206 | -0.153 | -11.4 | -0.011 | +0.142 | 39.9 | 32 | +2 | vs NE | 7 | +0.023 |
| 31 | LAC | Chargers | 0-6 | -0.212 | -0.245 | -7.9 | -0.279 | -0.034 | 35.1 | 30 | -1 | at LAR | 14 | +0.036 |
| 32 | TEN | Titans | 1-6 | -0.244 | -0.279 | -9.2 | -0.164 | +0.115 | 38.9 | 31 | -1 | at CIN | 7 | +0.015 |
12. Schedule and injury outlook
Week 8 opens Thursday with Carolina Panthers at Green Bay Packers, both on 4 days of rest (17th against 22nd in our ratings). Chicago Bears (11 days) visits Seattle Seahawks on Monday night, 5th against 4th. Kansas City Chiefs visits Denver Broncos, Baltimore Ravens visits Buffalo Bills (14 days of rest), Indianapolis Colts visits Jacksonville Jaguars (14), the Chargers visit the Rams (14), Washington Commanders (13) hosts Philadelphia Eagles, and Tennessee Titans visits Cincinnati Bengals. San Francisco 49ers, Houston Texans, the New York Giants and New Orleans Saints are on bye. Injury context from the official Week 7 report: Baltimore Ravens (Lamar Jackson) and Cleveland Browns (Dillon Gabriel) were Out at quarterback; San Francisco 49ers was without Nick Bosa, Deebo Samuel and Mike Evans; Tampa Bay Buccaneers without Antoine Winfield Jr. and Emeka Egbuka; Indianapolis Colts without Sauce Gardner and Tyler Warren. Week 8 reports post midweek. Remaining opponent strength is the average net rating of a team's remaining opponents (higher is harder).